Ag Weather Forum
Corn Yields in Super El Nino Years
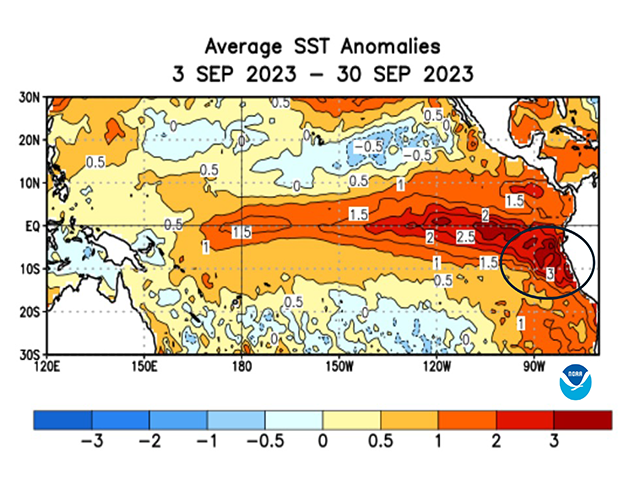
El Nino is definitely on the scene in the central and eastern equatorial Pacific Ocean. From the International Date Line to the west coast of South America, sea surface temperatures going into October are at least 1 degrees Celsius (1.8 degrees Fahrenheit) above normal. And at the eastern edge of this vast segment of ocean, the temperatures off the Ecuador and Peru coastlines are running as much as 3 degrees C (5.4 degrees F) above normal. That's a similar level of warming to so-called "super" El Nino events of 1982, 1997 and 2015.
El Nino is defined on Wikipedia this way: "El Nino (is) the warm phase of the El Nino-Southern Oscillation (ENSO) and is associated with a band of warm ocean water that develops in the central and east-central equatorial Pacific (approximately between the International Date Line and 120 degrees West), including the area off the Pacific coast of South America. The ENSO is the cycle of warm and cold sea surface temperature (SST) of the tropical central and eastern Pacific Ocean."
An El Nino overview by the U.S. National Oceanic and Atmospheric Administration (NOAA) notes that "El Nino can significantly influence weather patterns, ocean conditions and marine fisheries worldwide." El Nino conditions are reached when Pacific equator-region sea surface temperatures of at least 0.5 degrees C (0.9 degrees F) above normal are maintained over a three-month period.
For U.S. agriculture, the relationship between El Nino and corn production is an important one. And, given how the current El Nino is showing some characteristics of become at least a strong event--and possibly a "super" El Nino, it's useful to see how corn production fared in the previous three El Nino events which achieved "super" strength.
P[L1] D[0x0] M[300x250] OOP[F] ADUNIT[] T[]
Going from oldest to most recent, we find the following details from the USDA annual reports:
-- In 1982, U.S. corn production and yield set new records for the time at 8.4 billion bushels (bb) with an average yield of 114.8 bushels per acre (bpa). The yield number was notably higher than the previous year -- 5.0 bpa above the 1981 yield.
-- In 1997, U.S. corn production totaled 9.37 bb with an average yield of 127.0 bpa. The yield was virtually the same as recorded in 1996, but production was the third-highest on record behind 1994 (10.1 bb) and 1992 (9.48 bb).
-- Moving to 2015 and the third "super" El Nino growing season, we find that U.S. corn production total 13.601 bb with a yield of 168.4 bpa. In this year, production was actually 4% lower than the previous year, and the average yield was also 2.6 bpa lower than the previous year 2014.
So, two of the previous three "super" El Nino growing seasons brought either record or near-record production and yield numbers to the U.S. corn crop. Growing season 2024 conditions are still a long way off; however, a general impression from these details on how previous "super" El Nino events treated the U.S. corn crop is: While there is variability, the high strength El Nino events in history treated U.S. corn production well in total. These comparisons will continue to be monitored as this El Nino goes through its own history into next year's row crop season.
More details on the current El Nino compared with "super" El Nino years are available here: https://www.dtnpf.com/….
To see the latest USDA report released Oct. 12 on what is being estimated for crop production for 2023-24, see "USDA Reports Summary," https://www.dtnpf.com/….
Bryce Anderson can be reached at Bryce.Anderson@dtn.com
Follow him on X, formerly known as Twitter, @BAndersonDTN
(c) Copyright 2023 DTN, LLC. All rights reserved.


