

Todd's Take
Interest Rates, Markets Challenge Old Habits of Storing Corn
Here in mid-August, I'm keenly aware that we still have a lot to learn about how big the corn crop will be in 2023, but also can't help trying to think ahead a little, should the crop come in anywhere near USDA's near-record estimate of 15.111 billion bushels (bb).
In the land of X, formerly known as Twitter, there seems to be plenty of debate between those who believe the rains of July and August have miraculously revived crops from their near-death experience in late June and those that believe this year's early stress exacted an expensive toll on crop development. There are plenty of pictures to make cases for both sides and I'm inclined to lean bearish.
As I said in Tuesday's DTN Ag Summit Series, I was impressed and persuaded by the analysis from Gro Intelligence at the start of DTN's Digital Yield Tour on Aug. 7. In particular, the sharp recoveries of photosynthetic activity seen in satellite-mapped vegetative indices in July and early August were strong witnesses for the bearish prosecution, and we have had more beneficial rains since. This juror is still skeptical enough to want to see the large sample of field data that USDA's NASS promises to include in the Sept. 12 Crop Production report, but if I had to vote on corn price today, I would vote bearish, knowing also that Brazil is two-thirds harvested and on track for record production in 2023. Even if USDA's production estimate is dialed back 200 million bushels (mb) this fall, there is still plenty of corn to be added to both U.S. and world supplies.
Pondering the possibility of a bearish outcome this fall, I'm also concerned few will want to pay for storage in this era of higher interest rates and may be more willing to let go of their corn at harvest. On the other side of the coin, commercials may try to stretch out their purchases over the season, not wanting to tie up capital in a large early purchase of grain inventory. The question becomes, if corn prices take it on the chin at harvest time, will we still be able to expect a decent post-harvest rally?
P[L1] D[0x0] M[300x250] OOP[F] ADUNIT[] T[]
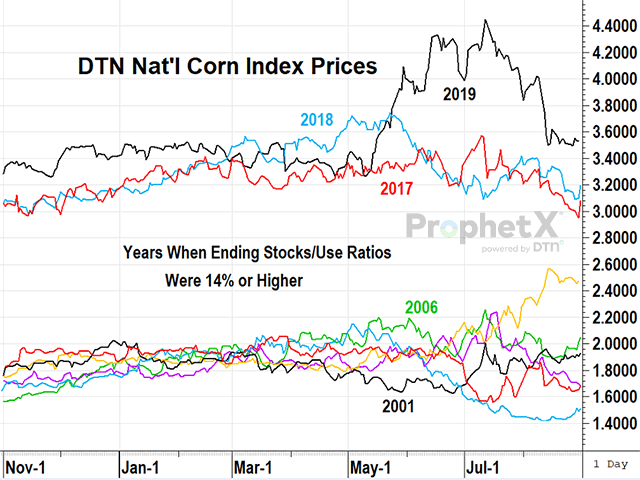
Questions like that never have a certain answer, but we can look at previous seasons when the corn surplus was heavier than usual to get an idea of what to expect. Knowing USDA is currently estimating an ending stocks-to-use ratio of 15.3% in 2023-24, I looked at cash corn prices represented by DTN's National Corn Index the past nine seasons that the stocks-to-use ratio was 14% or more.
After mapping out prices on the first business days of November, January, March and May I show that corn prices ended higher in May than they were in January by an average of 25 cents a bushel for all nine years. The main finding that jumped out was that the bulk of the gains, an average of 14 cents, were reached by Jan. 1. Even when expressing gains in terms of percentages, over half of the 13% average gain from Nov. 1 to May 1 was achieved by early January. After Jan. 1, the slope of the increase was less dramatic. In a low interest rate environment, that wouldn't matter as much, but when you're paying higher storage costs and may have an operating note, time and money are ticking against you.
Since USDA is estimating the ending stocks-to-use ratio for soybeans at 5.8%, I also looked at soybean prices for the nine most recent years when stocks-to-use ratios were 7% or less, a tighter situation than corn. In this case, cash prices from DTN's national index showed an average gain of $1.40 per bushel when held to May 1. You should also know that the results were more volatile, and two of the nine years showed losses. The largest loss was $1.01 per bushel in the drought season of 2012-13. There were also two years with gains of over $4.00 a bushel.
One of the drawbacks of the two examples above is that we can be misled by their small sample sizes. The more samples we include, the further back we go in history when conditions were much different. It is also important to recognize that Brazil has become a more ferocious competitor in corn and soybeans the past two years, and it is reasonable to expect narrower windows of opportunity for marketing both crops in the future.
Limitations aside, I do think there is a strong case here to try to be out of corn by early January, even if you are storing on your own farm and are debt-free. Big surpluses and high interest rates are not a good combination for expecting higher prices as time is not on corn's side. As for soybeans, no one can guarantee you'll make a return storing soybeans, but if you want to store something, store the crop with tighter supply prospects. I hear a lot of producers traditionally don't like to store soybeans and, unfortunately, this year a lot of producers didn't plant soybeans. This is a good time to slow down and reconsider old habits.
**
Comments above are for educational purposes only and are not meant as specific trade recommendations. The buying and selling of grain or grain futures or options involve substantial risk and are not suitable for everyone.
Todd Hultman can be reached at Todd.Hultman@dtn.com
Follow him on X, formerly known as Twitter, @ToddHultman1
(c) Copyright 2023 DTN, LLC. All rights reserved.