

Todd's Take
Recent History Offers Tips for Selling Old-Crop Soybeans
If there is one thing the market seems fairly confident about right now, it is that old-crop soybean supplies will be tight this summer. As of Thursday, April 13, May soybeans at $15.01 were up 26 1/2 cents from March 30, the day before USDA announced March 1 soybean stocks were lower-than-expected at 1.685 billion bushels (bb). Similarly, China's soybean prices are up nearly 4% since March 30.
USDA chose to keep its estimate of U.S. ending soybean stocks unchanged at 210 million bushels (mb) in Tuesday's World Agricultural Supply and Demand Estimates (WASDE) report, but that didn't discourage the market's bullish view. The firmness of soybean prices relative to product values has resulted in a dramatic drop in the crush premium for the first time in over a year. Based on May futures prices, this year's peak of $3.31 on March 6 was down to $2.11 on Thursday, a sign that demand rationing has begun.
The most bullish cheerleader for old-crop soybean prices has been the May/July soybean spread. After starting 2023 with a discount of 3 cents, the May contract started showing a premium on Jan. 12 and never looked back. On Thursday's close (April 13), May soybeans ended 27 3/4 cents above the July, the largest May premium over a July contract for that date since 33 3/4 cents in 2013.
For soybeans, there are a lot of similarities to 2013 worth noting, including bullish futures spreads. After coming off the drought of 2012, USDA estimated 125 mb of U.S. ending soybean stocks in the April 2013 WASDE report, an extremely tight view of supplies. The May soybean price on April 12, 2013, was $14.13 and would go off the board one month later at $15.24 1/2.
Another similarity with 2013 is that, in April, both years were anticipating larger crops in the fall. In the May 2013 WASDE report, USDA expected soybean production to increase from 3.015 bb in the drought year of 2012-13 to 3.39 bb in 2013-14. We won't have USDA's new-crop estimate in 2023 until May 12, but there is an expectation for a larger soybean crop this fall. In late February, USDA offered a new-crop production estimate of 4.510 bb, up from 4.276 bb in 2022.
P[L1] D[0x0] M[300x250] OOP[F] ADUNIT[] T[]
It is also interesting to note that, in both April 2013 and April 2023, there were and are early concerns about snow in the northwestern Plains, creating cold and wet conditions that could make timely corn planting difficult. In 2013, the U.S. came through with a much larger corn crop and a larger soybean crop of 3.358 bb. In 2023, we have yet to see how the story ends.
The comparison with 2013 gives bullish hope for old-crop soybean prices in 2023 -- to a point. As May 2013 soybean prices absorbed bullish attention in its final days of trading, the July contract started to trade higher and closed at a new one-month high of $14.19 on May 13. July soybeans then proceeded higher, reaching a peak of $16.13 on July 9.
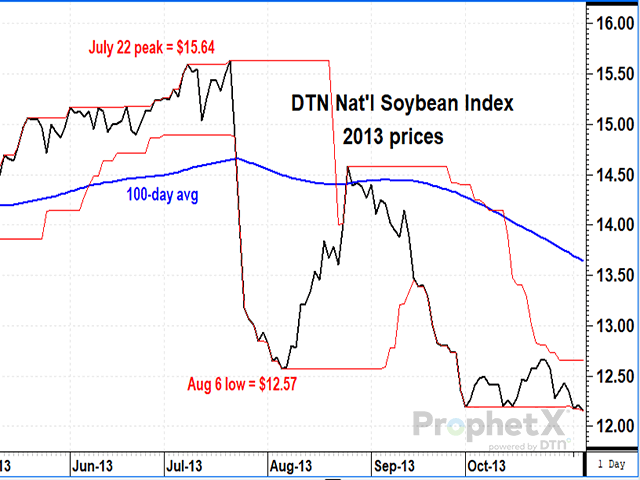
The July/August spread also showed a large bullish inverse in 2013. Would August repeat the bullish pattern? Only briefly, as it turned out. When July soybeans were the lead month, August soybeans followed higher. After the July contract expired on July 12, the August contract tacked on another 90 cents, peaking at $15.20 on July 22. After that, however, August soybean prices fell sharply, from $15.20 to $13.24 by Aug. 6. For DTN's national index of cash soybean prices, the drop was even more dramatic, going from $15.64 on July 22 to $12.57 on Aug. 6.
In contrast, a comparison with 2021 offers a less-bullish view. In 2021, USDA's April WASDE report estimated old-crop ending soybean stocks at 120 mb. The May premium over July on April 13, 2021, was 4 3/4 cents -- not as large as Thursday's 27 3/4 cents, but a sign of a tight-supply situation. DTN's National Soybean Index peaked at $16.47 on May 12, 2021, and fell to $12.92 by June 17. Clearly, this was a case where the bullish promise of old-crop supplies did not have the same staying power as it showed in 2013. The 2021-22 season ended with USDA estimating ending soybean stocks at 274 mb, a bearish surprise for many. Looking back, the first sign of trouble was when July soybeans fell to a new one-month low on June 14 -- an early end to what once looked like a bullish summer.
As I see it, the lesson from the above comparisons of 2013 and 2021 is that, even when old-crop soybean supplies are expected to be tight, we can't just assume old-crop prices will stay bullish until the end of August. Yes, the potential for higher prices is there, but many factors go into pricing, and conditions can change through the summer. In short, USDA's current estimate of 210 mb of ending soybean stocks is just part of the story.
DTN Six Factors Strategies have already advised being out of old-crop soybeans as prices were generously profitable for most producers. For anyone still holding old-crop soybeans, I suggest at least having a plan of protection -- tight supplies won't necessarily support prices all summer.
**
Comments above are for educational purposes only and are not meant as specific trade recommendations. The buying and selling of grain or grain futures or options involve substantial risk and are not suitable for everyone.
Todd Hultman can be reached at todd.hultman@dtn.com
Follow Todd Hultman on Twitter @ToddHultman1
(c) Copyright 2023 DTN, LLC. All rights reserved.