

Todd's Take
Just How Bad Is The Economy? Here's a Simple Stress Test
Back in January, I had a bit of a rant in this space, railing against the incessant drumbeat of recession talk in the news. The number of people with jobs in the economy surpassed the pre-COVID peak in December for the first time since 25.5 million jobs were lost in the early months of 2020. The news turned even brighter Friday, Feb. 3, after the Labor Department reported the number of U.S. jobs climbed to 160.1 million in January, the highest in history.
Part of my frustration has been that I'm concerned the vocabulary of macroeconomic theory has dulled us to the goings on of the human ant colony we call the "economy." With apologies to Thomas Jefferson, all men are not created equal, and neither are the companies that make up the great abstract blob we call the "economy." Instead of yelling "get off my lawn" at the way things are, I am offering a simple model to help shed some light.
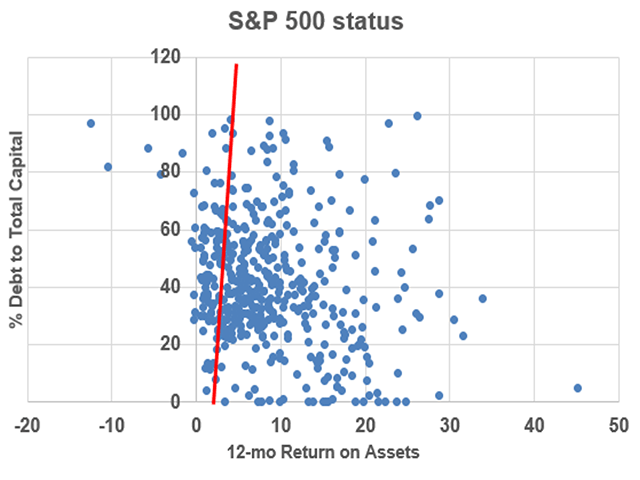
Using the companies of the Standard and Poor's 500 Index as an imperfect proxy for the economy, and with the help of the free stock screener at Zacks.com, I built a scatter chart, arranging companies by their level of debt on one axis and their level of profitability on the other. Companies have their own unique debt terms and arrangements, but whatever the costs, we can see how much companies made the past 12 months, relative to total assets.
Fourth quarter earnings are past the halfway point, and I need to note the stock screener could only give us results for 472 of the 500 companies in the index, possibly due to insufficient data. As of Feb. 9, 2023, the model showed 12 of the 472 companies lost money the past 12 months. The six worst results were cruise lines and casinos, wreckage from the pandemic. The remaining six companies with negative returns reported losses of less than a half-percent on assets -- not overly tragic after a year when the Federal Reserve raised the federal funds rate seven times and influenced an increase in the prime rate from 3.25% to 7.50%. Both the federal funds rate and prime rate were hit with another quarter-percent increase on Feb. 1.
P[L1] D[0x0] M[300x250] OOP[F] ADUNIT[] T[]
On the other end of the spectrum, there were 148 companies with 12-month earnings of 10% or more of total assets, even after the rate hikes and worries of recession. After paying higher diesel and fertilizer bills in 2022, U.S. farmers will not be surprised to hear oil and fertilizer companies fared well. Many well-known names that are not cyclical also made the list. Generally speaking, the companies in this group have little to fear from today's bearish headlines.
Another nice feature of the model is that we can perform a simple stress test to get an idea of just how vulnerable these companies are to today's interest rate and recession worries. Federal Reserve Chairman Jerome Powell recently said there may be a couple more rate hikes ahead, but nobody knows for certain. If we take a dim view of the future and increase the parameters on the model to reflect a 2-percentage point increase in the interest rate and a 2-percentage point drop in companies' return on assets, we see that the number of companies suffering negative returns on assets expands from 12 to 90.
As bad as that might sound, 64 of the 90 losing companies would suffer negative returns on assets of 2% or less and could be helped by some belt-tightening -- something many companies have room for after years of low interest rates. Of the 36 companies in the higher risk category for larger losses, many are financial firms notorious for carrying high levels of debt. Some of the familiar names that required bailouts in the meltdown of 2008-09 are in this higher risk category.
No model is a perfect substitute for the economy and there is no guarantee economic conditions won't get worse than the simple stress test offered above. After hearing nonstop about the impending recession since June, however, I do think it is important to find a source of information more credible and insightful than the daily news.
Traders sold off their long positions in corn and soybeans this summer largely because they listened to the crowd of public opinion instead of listening to someone who did his or her homework, and it cost them dearly. For producers marketing grain, that's a good lesson to keep in mind.
At farm shows, folks sometimes tell us they don't need DTN because they can get the information they need free off the internet. I can't speak for the internet, but I can tell you at DTN, we do our homework. Are you going to be at the National Farm Machinery show Feb. 15 to 17? Stop by the DTN booth No. 2000 in the West Pavilion and say hi. DTN Meteorologist John Baranick and I will be talking weather and markets for 2023 each day in DTN's seminar room.
**
Comments above are for educational purposes only and are not meant as specific trade recommendations. The buying and selling of grain or grain futures or options involve substantial risk and are not suitable for everyone.
Todd Hultman can be reached at todd.hultman@dtn.com
Follow Todd Hultman on Twitter @ToddHultman1
(c) Copyright 2023 DTN, LLC. All rights reserved.