
Best Blog of the Week
Ag Weather Forum: Corn Yield Changes After Triple-Dip La Nina Events
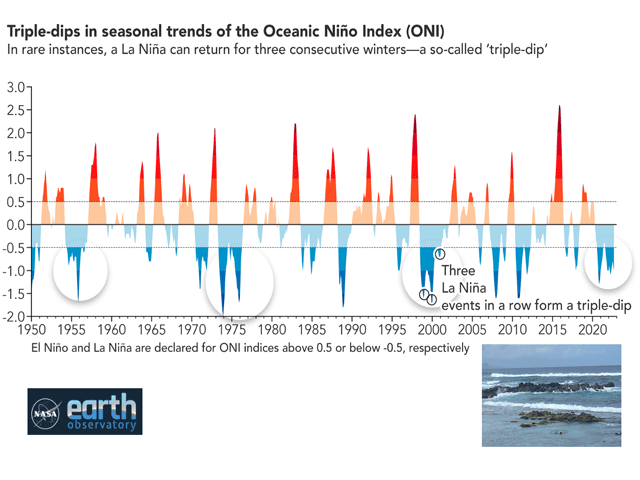
By now, the term "triple-dip La Nina" is a familiar one to many of you. "Triple-dip" refers to a La Nina which runs at least three years with little or no change in the Pacific Ocean cool-water phase.
And we're triple-dipping with this La Nina; the Pacific Ocean in the equatorial sector of the ocean between South America and the International Date Line is into its third Northern Hemisphere winter of being cooler than normal.
Using a running three-month sea surface temperature analytical tool called the Oceanic Nino Index, this La Nina started in the July-August-September period back in 2020 and has continued almost uninterrupted ever since. (The threshold for sea surface temperatures to reach La Nina category is minus 0.5 degrees Celsius.) The Pacific is still in the La Nina phase, but long-term forecasts from weather forecast agencies worldwide are calling for the Pacific temperatures to moderate from the cool values relative to normal to at least neutral during the January-February-March period, with a possibility of El Nino developing during the late summer-fall time frame.
P[L1] D[0x0] M[300x250] OOP[F] ADUNIT[] T[]
The Oceanic Nino Index (ONI) is used by the U.S. Climate Prediction Center (a division of NOAA) goes back to 1950. In that stretch of 70-plus years, three La Nina events are identified as being "triple-dip" events. They are 1954-56, 1973-76 and 1998-2001. As a point of interest, here is a look at how corn production fared in the season following those three identified "triple-dip" events, using information from USDA Annual Crop Reports.
Back in the mid-1950s, the Pacific had La Nina in effect from 1954 to 1956. The La Nina event began in the April-May-June period in 1954 and lasted until August-September-October 1956. So, the first season after La Nina ended was the 1957 crop year and featured El Nino. And, for the time, it was a good year. Total corn production hit 3.40 billion bushels (bb), 9% above the 10-year average. Corn yield was robust and a new record at 46.8 bushels per acre (bpa).
Twenty or so years later, the Pacific had a very strong La Nina from the April-May-June period in 1973 to the March-April-May period in 1976. And even though La Nina lasted into the springtime of 1976, corn production did well. In fact, corn output was a record for the time at 6.22 bb. Corn yield was stout at 87.4 bpa and included record yields in 19 states. The Pacific had a quick change in its character during 1976 as El Nino set in during August-September-October according to the ONI.
Another two decades later came the next three-year La Nina, which ran from June-July-August 1998 to January-February-March 2001. Corn production and yield were mixed compared to the previous crop year; corn production came in 4% below the previous year at 9.51 bb while yield at 138.2 bpa was the second highest on record and just over 1 bpa more than in the 2000 crop year. The 2001 growing season had a neutral Pacific in place.
The numbers from the outcomes of crop years following the three previous "triple-dip" La Nina events suggest that a decent and possibly good year for corn production lies in store. At the least, the indications point to a season without a widespread problem for production and yield.
Bryce Anderson can be reached at Bryce.Anderson@dtn.com
Follow him on Twitter @BAndersonDTN
(c) Copyright 2023 DTN, LLC. All rights reserved.