

USDA Reports Review
Soybeans Plunge on Bearish Stocks Data, Higher Crop Revision
USDA's Sept. 1 Grain Stocks and Small Grain Summary featured bullish corn and wheat data, and bearish soybean data, sending the soy market to large losses by day's end. Wheat finished sharply higher on bullish stocks and production, and corn rallied to close higher, but finished well off the daily high.
CORN
While there was a sense that the September National Agricultural Statistics Service (NASS) Quarterly Stocks report could show better-than-expected usage numbers for corn, very few expected the extent of the surprise traders would be met with. The revelation that had Sept. 1 corn stocks falling 120 million bushels (mb) shy of the average trade estimate from the Dow Jones survey would have sent the market higher by itself. However, when last year's crop was revised lower by 41.4 mb on a fall in yield and acreage, that added to the bullish reaction, sending December corn up nearly 27 cents at one point.
With the average trade estimate for Sept. 1 corn stocks coming in at 1.497 billion bushels (bb), traders were met with a 1.377 bb number instead. That was down 148 mb from the last World Agricultural Supply and Demand Estimates (WASDE) report and represented a June through August disappearance of 2.97 bb, compared to 2.88 bb a year ago. Larger feed and residual use and a 41.4 mb downward revision in the 2021-22 corn crop to 15.074 bb, as the result of lower yield and acreage, were reasons for the big change. Planted acreage was 93.3 million, with harvested acres falling to 85.3 million, while yield was reduced 0.3 bushels per acre (bpa) to 176.7 bpa. The lower-than-expected stocks number was comprised of 510 mb on-farm stocks, up 24%, and 867 mb off-farm stocks, up just 3%. The net effect of Friday's changes is the possibility for the 2022-23 ending stocks number on corn to move closer to the 1 bb mark. Any downward revision in the yield toward 170 bpa, which many private analysts have suggested could happen, would be a very bullish tightening of supplies.
December corn ended up by finishing only 8 cents higher in trade Friday, nearly 19 cents below the daily high. Despite the drop in corn supplies, demand for both export and ethanol have been dismal of late, with corn export sales running nearly 50% lower than last year.
P[L1] D[0x0] M[300x250] OOP[F] ADUNIT[] T[]
SOYBEANS
Soybeans are where the biggest surprise came Friday. With the estimate from the Dow Jones survey pegging Sept. 1 stocks at 247 mb, the report came out 27 mb higher than that estimate at 274 mb and 17 mb higher than last year's 257 mb ending stocks. In addition to that, the 2021-22 soybean crop was revised higher by 30.2 mb to 4.465 bb on a rise in yield to 51.7 bpa and a rise in harvested acres to 86.3 million. On-farm soy stocks were just 62.9 mb, down 8%, while off-farm stocks were up 12% from last year at 211 mb. The 274 mb higher stocks number is up 34 mb from the WASDE report last month.
The soybean stock number implied a June through August disappearance of 698 mb, up roughly 36% from a year ago. The upward revision in stocks, however, comes at a time when export demand has been sluggish, with increased competition from Argentina and Brazil.
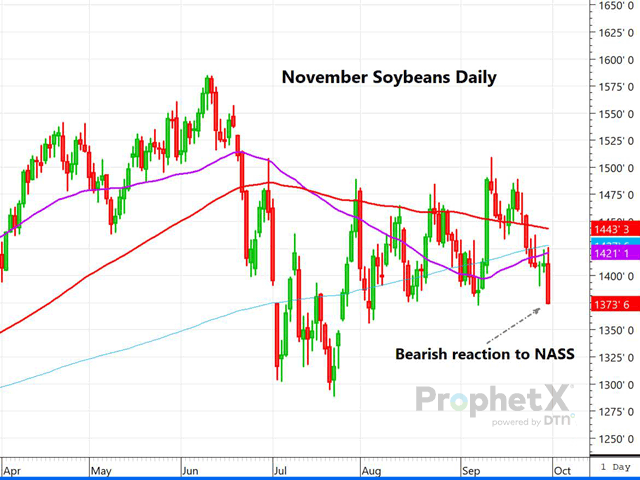
The losses in the November bean contract accelerated into the close, with November down 46 cents, and it would appear to be headed for the $13.49 open chart gap. The upward revision in stocks comes at an inopportune time, with the prospect for Brazilian soy production to reach the highest level ever, should beneficial weather continue.
WHEAT
The wheat market was hit with a double dose of bullish news on Friday's NASS report. First, Sept. 1 stocks came in about 19 mb under the average Dow Jones trade estimate of 1.795 bb at 1.776 bb, about equal to a year ago. On-farm stocks were at 591 mb and up 41% versus a year ago, while off-farm stocks were 1.18 bb and 13% lower than a year ago. The June through August disappearance for wheat figured to be just 543 mb, 24% lower than a year ago.
The big surprise in wheat came in an across-the-board lower production number. All-wheat production of 1.650 bb was far less than the trade estimate of 1.784 bb. That included a drop of 133 mb from the recent WASDE report. Winter wheat production was recorded at 1.1 bb, far below the 1.192 bb expected. Hard red winter fell to 531 mb, about 42 mb below the trade estimate, with soft red winter, at 336 mb falling a similar 43 mb below the average estimate. Other spring wheat at 482 mb was 35 mb below the trade estimate, while white winter wheat was nearly the same at 236 mb, and durum was just over 10 mb lower than expectations. Already higher prior to the report, both Chicago and KC finished roughly 25 cents higher Friday. Both the U.S. and world wheat stocks remain at the lowest level in years.
FINAL THOUGHTS
The net effect of the Sept. 30 NASS Quarterly Stocks and Small Grains Summary reports was to tighten up the wheat and corn balance sheets, while loosening up the soybean balance sheet. Soybeans took center stage as both last year's production and September stocks were revised higher, sending soybeans to sharp losses. The report helped stabilize corn and wheat, which have both suffered from recent weak export demand. The rise in soybean stocks, and an open path for harvest, at a time when export demand has sagged sent futures to big losses.
December corn finished 8 cents higher to close at $6.77 1/2. November beans plunged 46 cents to close at $13.64 3/4, the lowest level since early August. Kansas City December wheat finished up 24 3/4 at $9.91 1/4.
Dana Mantini can be reached at dana.mantini@dtn.com
Follow Dana Mantini on Twitter @mantini_r
(c) Copyright 2022 DTN, LLC. All rights reserved.