

Todd's Take
Market Insights From a Gifted Mathematician
I always find it fascinating how people find their interests in life. For Benoit Mandelbrot, a gifted mathematician with a broad record of contributions in many fields, he discovered an early interest in the geometry of irregular things. As he was often quoted as saying, "clouds are not spheres, mountains are not cones."
Mandelbrot's fascination with the challenge of how to measure the rough edges of a coastline and squiggly path of a river, as it turns out, also made him curious about the irregularity of market prices. Mandelbrot and co-author Richard L. Hudson first wrote "The (Mis)Behavior of Markets, a fractal view of risk, ruin and reward" in 1997, updated in a second edition in 2004 with the sub-title, "A Fractal View of Financial Turbulence." His ideas have changed the way many think about risk, but as you'll soon see, there are many more of us that could still benefit from his insights.
To be clear, this is not a book about how to make a million dollars overnight and I do not agree with all the author's market opinions, but the main insights of the book are worth the price of admission and are well supported by historical data.
Mandelbrot and Hudson offer an eye-opening view of market price behavior in the real world that is much more erratic than the more traditional views either economics or statistical analysis would lead us to believe. Mandelbrot first got a glimpse of this in 1962, while working for IBM when he received the opportunity to analyze more than a century of daily cotton price changes.
In the academic classrooms of Mandelbrot's day, financial models were largely based on assumptions that price changes in the market were no different than flipping coins. One standard deviation of price changes would describe 68% of results and two standard deviations would describe 95% of results. A certain average or equilibrium price would emerge from the data and it was assumed unusually large price changes would happen only rarely.
As Mandelbrot wrote about the cotton prices he examined, "Their variance, rather than holding steady as expected, gyrated a hundred-fold and never settled down to a constant value." In the world of financial theory, that was a bombshell.
One of Mandelbrot's students, Nobel prize-winning economist, Eugene Fama, looked at the price changes of 30 stocks in the Dow Jones Industrials and found similar, disturbing patterns.
P[L1] D[0x0] M[300x250] OOP[F] ADUNIT[] T[]
As Mandelbrot explained, "Large changes, of more than five standard deviations from the average, happened two thousand times more often than expected." Mandelbrot went on to say, "Under Gaussian rules (rules of normal price distribution), you should have encountered such drama only once every seven thousand years; in fact, the data showed, it happened once every three or four years."
Those of us that are not trained mathematicians may not think formally in terms of standard deviations, but it is common for many, myself included, to have a certain concept of "normal" market behavior, based on our experiences. We develop expectations about how things should be and when new, unusual behavior arises, our initial reflex is often to dismiss the aberration as a short-term fluke. We expect life to get back to "normal."
Mandelbrot's study of prices, however, shows that reality often doesn't match up to the view many of us have in our heads. Instead, the history of price changes among a wide variety of markets tend to fall into two categories, either lots of relatively small price changes during times of low volatility or much larger changes, associated with times of more volatile activity.
The market's larger price changes can be both larger in size than anticipated and also more frequent than expected. Somewhat like witnessing three 100-year floods within a short span of time, these unusual events happen more often than most of us would expect.
Taking Mandelbrot's findings one step further, not only do unusually volatile events happen more often than we expect, they tend to happen in clusters, which magnifies the impact on prices even more.
An example of this in grain markets is the currency crisis that started in Thailand in 1997, which quickly became an Asian crisis and later, a Russian crisis. Demand for U.S. grain dropped sharply at a time when the U.S. also experienced a string of several big corn and soybean harvests. The result was that crop prices were held below production costs for roughly five years. It was an unusually bearish time and the old saying, low prices cure low prices offered no help against the cluster of bearish events.
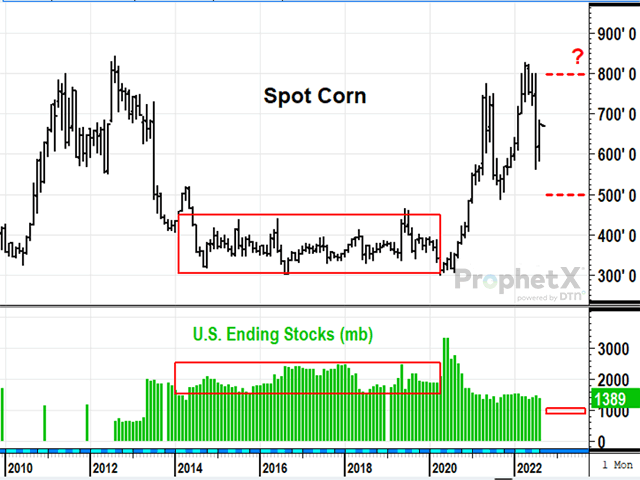
As I wrote in this space on Aug. 16, we are currently experiencing a bullish cluster of events in corn, soybeans and wheat with numerous obstacles to production keeping global supplies tight. (See https://www.dtnpf.com/…)
For livestock producers and other businesses that depend on buying these crops, the higher prices of the past two years have been painful at times and I see no sign yet of this unusually bullish situation being over. Today's obstacles to production are real, do not lend themselves to easy solutions and show no sign of abating yet.
For the producers of corn, soybeans and wheat, outside market concerns over slowing world economies and a fear of recession have eased some of the bullish pressure on prices lately, but don't solve the problem of having tighter-than-normal supplies heading into winter. There is always a risk of what lies ahead, but here in early September, prospects for higher bids by January look favorable.
Unfortunately for us, Mandelbrot died in 2010 at the age of 85. Given his many insights into the nature of price behavior, it would have been interesting to hear his views on today's markets. I doubt he would have been surprised.
To learn more about the work Mandelbrot pioneered, IBM has a helpful description and tribute posted at https://www.ibm.com/….
**
Comments above are for educational purposes only and are not meant as specific trade recommendations. The buying and selling of grain or grain futures or options involve substantial risk and are not suitable for everyone.
Todd Hultman can be found at Todd.Hultman@dtn.com
Follow him on Twitter @ToddHultman1
(c) Copyright 2022 DTN, LLC. All rights reserved.