USDA Reports Review
USDA June Acreage and Stocks Reports Get Bearish Reaction
The 2022 USDA June Stocks and Acreage reports was relatively neutral to slightly negative on corn and wheat and should have been bullish November beans. But mid- and late-day selling sent all three to sharp losses.
Here's a breakdown of corn, soybeans and wheat.
CORN
First, USDA reported that, at the time of the survey for the stocks and seeding report, which ended on June 16, there were 4.03 million acres (ma) of corn and 15.8 ma of soybeans left to plant. In July, National Agricultural Statistics Service (NASS) is to collect updated information on these acres, especially in the Dakotas and Minnesota, and if any changes need to be made, updates will be available in the Aug. 12 report.
Prior to the report, the Dow Jones survey of traders had the average estimate for planted corn acres at 89.7 ma. USDA pegged final acres at 89.9 ma -- slightly above expectations and compared to 93.36 ma a year ago, and 400,000 acres above the March intentions. Stocks of corn in all positions on June 1 were 4.346 billion bushels (bb) -- slightly more than trade expectations of 4.33 bb. Of that total, on-farm stocks were 2.12 bb and up 22%, while off-farm corn supplies, at 2.23 bb, were down 6% versus a year ago. Implied disappearance in the March-May quarter were 3.41 bb compared to 3.58 bb a year earlier.
Notable state-by-state changes on corn planted acres showed Illinois and Indiana down 300,000 acres from a year ago, Iowa and Nebraska down 200,000 acres each, South Dakota down 250,000 acres, Minnesota down 100,000 and North Dakota down 1.1 ma versus last year.
P[L1] D[0x0] M[300x250] OOP[F] ADUNIT[] T[]
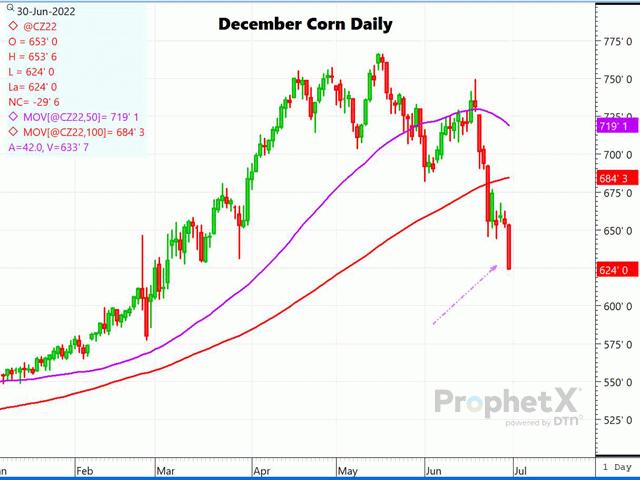
The stocks and acreage reports were considered to be mostly neutral. However, the forecast for better rain chances and the dismal corn export sales reported for last week sent futures spiraling lower. December futures before the report were down 17 cents and finished down a hefty 34 cents.
SOYBEANS
Based on the Dow Jones pre-report survey, traders had expected soy acres to be record large, at 90.4 ma, with the prior record 2017 acres of 90.2 ma. Instead, USDA's survey had planted bean acreage at just 88.3 ma -- still the most in four years, but a 2.7 million-acre drop from the March intentions. Iowa and Indiana acreage rose 150,000 to 200,000 acres, with Minnesota down 150,000 acres from a year ago, and down 500,000 acres from March intentions. Illinois was up 600,000 acres from a year ago, and up 200,000 from March intentions to a record-large 11.2 ma. North Dakota again lost the most acres, with the total down 1.350 ma from last year. Heavy rains and cool weather during planting were the likely culprit, sending some intended acres into the prevented planting program. The 88.3 ma would still be higher than 87.2 ma a year ago.
June 1 stocks of soybeans were revealed at a higher-than-expected 971 million bushels (mb), with the trade average estimate 12 mb below that. On-farm stocks were up 51% at 331 mb, while off-farm stocks, at 640 mb, were up 17% versus a year ago. March through May implied disappearance of soybeans amounted to 960 mb, and up 21% from last year.
While it seems that the lower acres should have had a much more bullish reaction as tight as old-crop soy supplies are, the net cancellation of old-crop sales on the Thursday morning sales report likely played a role in relative weakness. With Brazil beans currently cheaper, traders fear more cancellations or rolls to new crop could lie ahead.
WHEAT
NASS pegged all wheat acres at 47.1 million, compared to 47.4 ma last year and slightly above the 46.9 ma estimated by Dow Jones' survey prior to the report. Of that total, winter wheat was 34 ma -- just under the 34.2 ma average guess, but up from last year's 33.6 ma. Spring wheat acres, expected to fall to the lowest level since 1972, at 10.8 ma, instead came out at 11.1 ma, and down 3% versus a year ago. Durum seeding rose by 21% to 1.98 ma.
June 1 wheat stocks were pegged at a slightly higher-than-expected 660 mb, but down from 845 mb a year ago. On-farm stocks of just 93 mb are down 34%, while off-farm stocks of 567 mb figure 19% lower than a year ago. March-May disappearance is calculated at 364 mb, down 22% from a year ago.
CONCLUSION
USDA's June quarterly Grain Stocks and Acreage reports had few major surprises other than bean planted acres, but market action continued to display the wild volatility that we have seen all year. Soybeans completely ignored what should have been a bullish acreage report to close sharply lower, as did both wheat and corn. As tight as soy stocks are, the 2.7 ma fall in acres from March intentions should have resulted in a bullish reaction, but it did not. Wheat and corn also both melted down, with little in the report to suggest such a bearish reaction. The combined corn and soybean planted acreage fell to just 178.2 ma from 180.6 ma one year ago. It's no doubt that North Dakota was the major reason, along with sharply increased input costs.
Dana Mantini can be reached at dana.mantini@dtn.com
Follow Dana Mantini on Twitter @mantini_r
(c) Copyright 2022 DTN, LLC. All rights reserved.


