Todd's Take
Commodity Market Fundamentals Stumble in Today's Fast-Paced Environment
From an analytical point of view, to say Wednesday's supply and demand estimates from USDA were disappointing is an understatement. According to the agency, the U.S. is on track for 1.540 billion bushels (bb) of ending corn stocks in 2021-22 and an average farm price of $5.45 per bushel. U.S. soybeans are on track for 325 million bushels (mb) of ending stocks with an average farm price of $13.00 per bushel.
(See DTN's USDA Reports Review here: https://www.dtnpf.com/…)
Five months' worth of prices have already passed in the current season, so USDA's farm price estimates aren't much help as far as predictive guidance goes. New-crop prices, even for wheat, won't be estimated until May 12, 2022. I'm conveniently ignoring USDA's February Ag Outlook session, a virtual event scheduled for Feb. 24-25 this year. The event has lots of interesting speakers on good ag-related topics, but the crop price estimates are largely based on past projections and are not meant for serious consideration.
The whole notion that USDA's ending stocks estimates correlate to crop prices has long been on shaky ground. Most studies that try to find a relationship between ending stocks-to-use ratios and corn and soybean prices make the mistake of using final ratios after the crop season is over and the Sept. 30 Grain Stocks report has been released. For markets, this is somewhat like predicting the score in the bar after the game has already been played. Final ending stocks estimates of past seasons are not helpful for risk managers on the farm.
As part of DTN's monthly World Agricultural Supply and Demand Estimates (WASDE) webinar, I show a scatter chart of historical cash soybean prices over the past 25 years, indexed for inflation. The point of the chart is to allow us to see previous times when USDA was estimating a 7% ending stocks-to-use ratio for soybeans, as USDA is now, so we can get an idea of what prices to expect.
P[L1] D[0x0] M[300x250] OOP[F] ADUNIT[] T[]
Past prices for similar supply situations range from roughly $7 per bushel to $17, which is too wide to be helpful. A trendline through the statistical center of all the past prices gives us a historical target of roughly $12.00 a bushel for a 7% ending stocks-to-use ratio. The R-squared value of 0.47 suggests 47% of soybean prices can be explained by changes in USDA's ending stocks-to-use ratio. In other words, the $12.00 price target is a general guideline for what to expect with a lot of emphasis on the word "general." Estimating market prices based on USDA estimates is not a high probability venture.
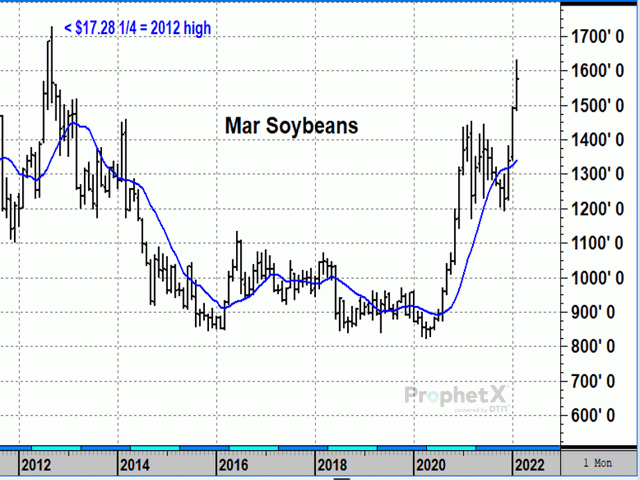
I'm not explaining this to bash USDA, but to make us aware of the limitations of the traditional fundamental method that many of us use to make marketing decisions. Given the abrupt changes that row crop prices saw in late 2020 and, most recently, the big bullish surges of the past three months, it has become increasingly obvious the traditional method is not able to keep up. For example, Thursday's (Feb. 10) DTN National Soybean Index closed at $15.26 per bushel, well above the $12.00 fundamental target from the scatter chart I described and USDA's average farm price of $13.00 per bushel. Current market prices have moved way out ahead of the fundamental assessments.
Looking back over the years, the thing that strikes me is the traditional fundamental approach seems most relevant during relatively stable periods when large disruptive changes aren't taking place. From 1974 to 2007, spot soybeans traded between roughly $5 and $9. Another quieter and mostly bearish period lasted from 2015 to 2019. It's in these quieter periods that we tend to get complacent. After all, supply and demand assessments seem to make sense and give us a feeling that we know what is going on. The old economic assumption of all else remaining equal works fine as long as the world doesn't change too much.
The problem is life doesn't always abide by the fundamental mold. As our recent experiences show, sometimes the world changes in dramatic ways and, when it does, we have to reduce the weight we give to fundamental assessments that just don't keep up.
The pandemic-stricken economy is not the same as it was before 2020. A sleepy rural Asian economy with a GDP per capita of $320 in 1990 is not the same as the world's second largest economy today. Just as ethanol changed the value of corn 15 years ago, renewable diesel appears to be changing the value of soybean oil and therefore soybeans today.
Even the actual corn and soybeans we plant today cannot be compared to the corn and soybeans of the past. Some changes are obvious and disruptive. Some happen like the minute hand of the clock, but they all make it increasingly difficult to compare today's markets to the past.
With DTN's Six Factors Market Strategies, we have numerous market clues other than USDA's fundamental assessments to depend on, and I am thankful for the variety and flexibility that is built into the approach. Rapidly changing markets like what we are currently in are not easy to keep up with and we obviously can't predict the future, but it helps to have good tools for the job.
I'll be speaking with DTN Meteorologist John Baranick at the National Farm Machinery Show in Louisville, Kentucky, on February 16-18. Please join us for relaxed discussion of what we expect for weather and market prices
**
Comments above are for educational purposes only and are not meant as specific trade recommendations. The buying and selling of grain or grain futures or options involve substantial risk and are not suitable for everyone.
Todd Hultman can be found at Todd.Hultman@dtn.com
(c) Copyright 2022 DTN, LLC. All rights reserved.


