Todd's Take
Counting on Corn's Seasonal Influence Isn't Profitable Every Year
I don't exactly remember what I was doing a week ago when DTN posted Kub's Den by Contributing Analyst Elaine Kub, "Paying for Corn Storage: Are You Feeling Lucky?" (https://www.dtnpf.com/…), but I do recall that I was busy at the time and had to come back and read it later that Wednesday.
I have to admit, I was initially bothered to see that Elaine made an extensive study of 51 years of corn prices and found that owning corn from October to March was not an impressive venture. As she noted, in 29 of the 51 years, prices either lost money or didn't make enough to offset storage costs of 3 cents per bushel per month.
The study bothered my inner geek, because I had done my own seasonal work and came up with much more profitable results. What was happening here? I know Elaine is no slouch when it comes to market research. How could we get such different outcomes?
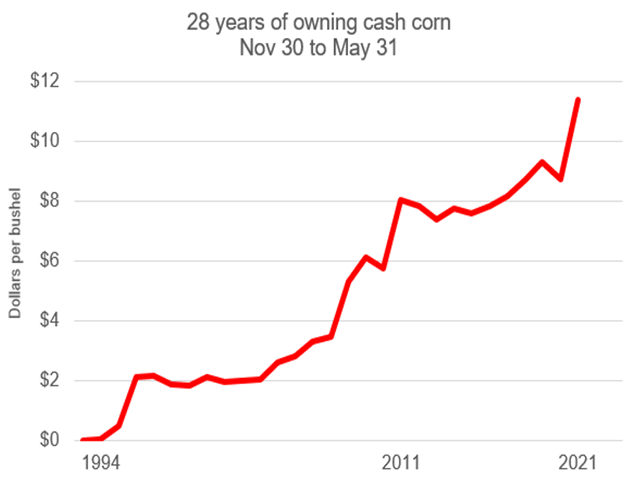
For the record, my seasonal work showed a theoretical gain of $11.38 over the most recent 28 years, averaging a gain 6 3/4 cents per month, ample room to cover most storage costs, especially if you own your own bins. I need to point out the gains as theoretical, not actual trades and do not take into account the cost of commissions or slippage.
After this week's World Agricultural Supply and Demand Estimates (WASDE) report, I had some time to take a closer look at our two studies and found important differences. Elaine's study went back 51 years and mine only went back 28 years. Was it possible that the most recent 28 years were more profitable than the previous 23 years?
Elaine's table was posted, so I grabbed the calculator and added up a total gain of $1.55 since 1993, averaging just 5.5 cents per year -- still not enough to pay for five months of storage costs.
Elaine's study used spot corn futures prices from Oct. 31 to March 31 of each year -- a five-month period. My work went from Nov. 30 to May 31 each year, a similar, but different six-month period. Another important difference was that I used the DTN National Corn Index cash prices.
P[L1] D[0x0] M[300x250] OOP[F] ADUNIT[] T[]
I wouldn't say the two studies are apples and oranges, but there were just enough differences to describe the two as tangerines and oranges. For risk managers, there are important practical lessons from comparing both studies that I want to emphasize.
One of the reasons I have always appreciated the seasonal influence in grains is because not only does it have a traditional history, it also appears to make good common sense. Low prices tend to accommodate abundant supplies at harvest and higher prices tend to show up early in the new-crop season when supplies are lower and end users are nervous about what the new season will bring.
Even so, both studies remind us that counting on the seasonal influence is not profitable every year. As the CFTC frequently warns, past performance is not necessarily indicative of future results. A knowledge of seasonals does not erase risk, and it is still important to consider the unique market factors of each year.
The two studies also demonstrate the limited robustness of corn's seasonal influence. Quantitative traders will say that you should be able to make minor changes to a good trading rule and still get good results.
It is interesting that my comparison of Nov. 30 to May 31 cash corn prices looks highly profitable, while Elaine's comparison of Oct. 31 to March 31 spot futures prices is so-so and less attractive than a roulette wheel. Those depending on corn's seasonals should know the profitable time span is narrowly defined.
Another example of corn's limited robustness was the fact that there are three years in my 28-year study that did exceptionally well: 1995-96, a time when drought was a concern and China was buying U.S. corn; 2007-08, the start of the ethanol boom, and most recently, 2020-21, a time of record and unexpected corn purchases from China.
Take those three years out of the study and the results fall from a total gain of $11.38 over 28 years to a gain of $5.27 over 25 years or roughly 3 1/2 cents a bushel per month. When I shared that finding with Elaine, her response was, "This makes the game sound less like roulette and more like a lottery, but it's a pretty generous lottery!"
After all this, I am thankful for Elaine's fresh set of eyes and have a new appreciation for this important market factor. The seasonal influence continues to be an important part of DTN's Six Market Factors with a richer understanding. Like the other five factors, seasonal tendencies have their limits and need to be considered in the context of the other market factors.
Here in early November, December corn appears to have made its seasonal low on Sept. 10 and is currently trending higher with good support from highly profitable ethanol margins. As we all know, those conditions can change, but for now, the outlook for corn prices looks favorable as we would traditionally expect for this time of year.
Continue this conversation in person at this year's DTN Ag Summit in Chicago on Dec. 5 to 7. I will be there, talking about the challenges of markets in 2022. Even better, we have several distinguished speakers, covering lots of topics important to your farm. Find out more and register at www.dtn.com/agsummit/.
**
Comments above are for educational purposes only and are not meant as specific trade recommendations. The buying and selling of grain or grain futures or options involve substantial risk and are not suitable for everyone.
Todd Hultman can be reached at Todd.Hultman@dtn.com
Follow him on Twitter @ToddHultman1
(c) Copyright 2021 DTN, LLC. All rights reserved.


