
Kub's Den
Ag Exports' Sensitivity to Container Congestion
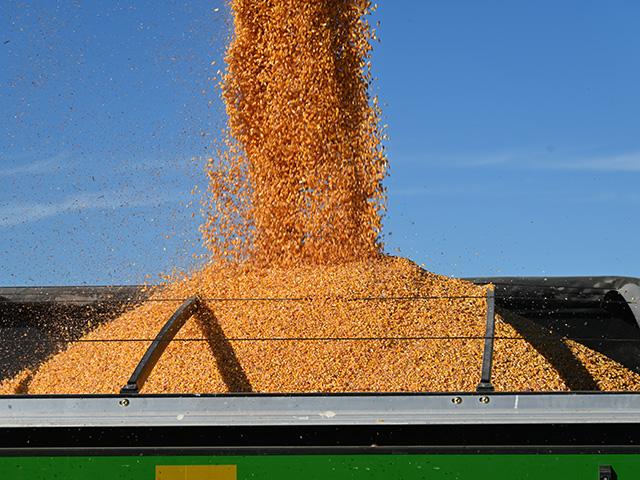
If you were asked to guess America's No. 1 agricultural export, you would almost certainly get it right -- soybeans. But would you guess how many of those soybeans were shipped inside containers (you know the ones: big, metal intermodal boxes that can be both stacked on ships and trains but also pulled individually by semi-trucks) instead of commingled in the bellies of great ocean vessels designed for dry bulk goods?
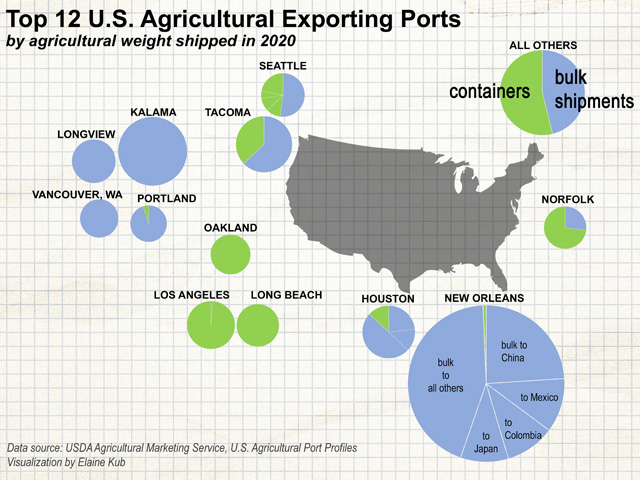
In 2020, nearly 55 million metric tons (mmt) of soybeans were shipped out of the U.S. in the typical bulk-hauling cargo ships, but over 6 mmt -- 10% of the total -- were shipped via containers. By far the biggest soybean export transactions last year were bulk shipments from New Orleans to China or from Kalama, Washington, to China or from New Orleans and other Gulf ports to Egypt, Pakistan, Japan or Germany. However, last November, there was a shipment of 76,000 metric tons of soybeans going from Norfolk, Virginia, to Taiwan -- all in containers. Other common container shipment routes for soybeans include Los Angles to Taiwan, Los Angeles to Indonesia, Long Beach to Vietnam or New York to Thailand. More soybeans leave this country in containers than all our meat and poultry exports combined (5.6 mmt).
Therefore, when we see headlines about congestion at the deep-water container port of Los Angeles -- and when shippers are desperate to get empty containers turned back around toward Asia, whether they're filled with backhaul commodities or not, we should be aware of the effects this disruption has on agricultural exports, and not just soybeans. The biggest agricultural commodity that leaves our shores in containers is classified by the USDA as "animal feed," which we can basically read as "DDGS":
P[L1] D[0x0] M[300x250] OOP[F] ADUNIT[] T[]
| METRIC TONS OF U.S. CONTAINERIZED EXPORTS IN 2020: | ||
| Animal feed, hay | 9,422,492 | |
| Soybeans | 6,049,912 | |
| Meat | 3,036,563 | |
| Poultry | 2,651,852 | |
| Raw cotton | 1,981,478 | |
| Vegetables | 1,894,377 | |
| Grain products | 1,670,296 | |
| Grocery items | 1,500,809 | |
| Edible nuts | 1,268,764 | |
| Bulb & seeds | 1,086,365 | |
| Dairy products | 1,045,810 | |
| Fruit | 713,449 | |
| Rice | 700,138 | |
| Bulk Grains | 159,747 | |
| Soybean oil | 43,959 | |
The big, containerized shipments of DDGS (or other animal feed) tend to move out of either New Orleans to Turkey, Thailand or Colombia, or out of Tacoma toward Japan. DDGS are also shipped as a bulk product, especially to Mexico, but actually a majority (73%) of this "animal feed/hay" category ships out packed in metal boxes.
For the core commodity grains, however, the markets can mostly continue to ignore the bottleneck at the container ports. Instead, the markets' No. 1 concern should still be getting the stuff to the customers in the usual ways: riding on a train or barge to an export facility, then across the ocean in a big dry bulk vessel.
Fortunately, train and barge transportation has been ticking along smoothly during the gut slot of harvest 2021. Bids for grain railcars in the secondary auction market, at only $23 per car in October, are the lowest seen for this time of year in the past three harvests, and grain car order fulfillment by the railroads has been almost perfect all month so far, with very few orders one to 10 days late and zero cars past 11 days late. Meanwhile, downbound grain barge rates have seen a fairly typical October spike, and are 17% higher than they were a year ago alongside higher energy prices yet remain below historical highs from years like 2014 or 2008.
Ocean freight rates, on the other hand, are now the highest they've been since the commodity rally of 2008. This is obviously true for container shipping. It now costs over $20,000 to ship a 40-foot container from China to the U.S. East Coast, compared with normal rates more like $2,500 per container back in 2019. Even dry bulk ocean shipping rates have been influenced by the bullish market environment. The Baltic Dry Index has surged above 5,000 this October (which roughly represents the price in U.S. dollars to hire a cargo ship for one day), with quite a way to go before retesting its all-time high of 11,793 in May 2008. USDA's weekly Grain Transportation Report shows the freight rate to ship grain from the U.S. Gulf to Japan rose to $82 per metric ton in September, roughly double what it was a year ago. That means instead of costing a fairly normal $1.22 per bushel to ship wheat or soybeans from the Gulf to Japan, it now costs $2.23 per bushel -- raising our end users' price tag by roughly a dollar per bushel.
If supplies were any less tight than they are, we would expect to see some of that cost shared back to farmers via weaker basis bids, but with the grain inventory situation as it is, so far, these higher shipping rates are mostly just adding to the landed costs of the grain and to global food price inflation.
Therefore, don't underestimate the agriculture industry's exposure to the supply chain congestion. It's more than just an inability to get the tires, widgets or chemicals we need shipped here in a timely manner. There are knock-on effects all throughout the freight rate environment, even for the seemingly smooth-running commodity grain bulk shipments.
**
Elaine Kub is the author of "Mastering the Grain Markets: How Profits Are Really Made" and can be reached at masteringthegrainmarkets@gmail.com or on Twitter @elainekub.
(c) Copyright 2021 DTN, LLC. All rights reserved.