
DTN Progressive Farmer Digital Yield Tour
Data Put to the Test
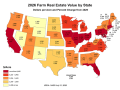
Once August rolls around, farmers have a pretty good sense of yield potential in their corn and soybean fields, but it's much more difficult for them to determine what county, state or national yields will look like on their own.
That's why DTN partnered with Gro Intelligence four years ago to launch the one-of-a-kind DTN/Progressive Farmer Digital Yield Tour, which runs Aug. 9 through 13. DTN reporters pair Gro's state-of-the-art yield models with insights from farmers, agronomists and other experts in 10 states to paint a picture of state and national yield potential months before USDA releases its most reliable estimates.
"Over the past three years, the satellite-driven nature of this digital yield tour has allowed us to highlight the real-time impact of the 2020 derecho, examine the effects of unprecedented prevented-planting acreages and observe overall crop conditions as they're evolving," explains Greg Horstmeier, DTN editor-in-chief.
"The broad imagery allows us to account for the entire crop within the Yield Tour states, not just a subset of random fields," he adds. "Farmers may sell their grain locally, but the price they're paid is influenced by the entire crop, by fields far from their horizon line. They've told us the analysis from these stories helps them make critical marketing decisions with direct benefits to their bottom lines."
USDA's National Agricultural Statistics Service starts publishing national yield estimates in August that are based on surveys of farmers as well as field samples and measurements, but its most reliable and final estimate isn't released until January.
On the other hand, Gro's yield models, which update daily, start showing high levels of statistical accuracy compared to USDA's final yield estimates toward the end of July. Gro usually releases a final estimate around the end of harvest, in mid-November.
"Our corn model has a 2% error rate, which is about 3 bushels," Gro senior research analyst Will Osnato says, adding that some years have been closer to the mark than others. For soybeans, the error rate is 2.5%, or 1.1 bushels. "It's not about predicting what the USDA is going to say in the August report or the September report, but really what the final number is going to be."
MACHINE LEARNING
Gro's corn model, for instance, uses 130 data points for each crop district, which includes NASA satellite imagery, land surface temperatures, rainfall data, weather forecasts, soil moisture, USDA crop-condition surveys and much more. Machine learning helps the models generate district-level estimates that are then used to formulate state and national yield estimates.
P[L1] D[0x0] M[300x250] OOP[F] ADUNIT[] T[]
"It'll learn how weather variables impact each of the districts individually, and then learn from the combination of all of them together, so it's really multiplicative," he says. Gro's U.S. corn model includes 900 counties, while its soybean model includes 1,800 counties. "How all of those data points interact is beyond what you could calculate by hand or in Excel," Osnato adds.
Gro, which produces 13 different yield models for corn, soybeans and wheat in different parts of the world, is also constantly looking for ways to improve its models. A new feature included in the U.S. corn-yield model for the 2021 growing season is the Gro Drought Index. It's also a machine-learning model that was developed using historical U.S. Drought Monitor data but updates daily as the latest information on rainfall, evapotranspiration and other features become available.
Osnato says the company included its Drought Index in its Brazilian corn model first. Early in that crop's growing season, Gro's estimates were much lower than those from other sources, including CONAB, the Brazilian equivalent of USDA. As drought conditions for the safrinha crop worsened, most of those other estimates moved closer to Gro's.
"We tested the Index in a variety of yield models, and it proved to be useful in the U.S. corn model," Osnato explains, but it didn't make enough of a difference statistically to be included in the U.S. soybean model.
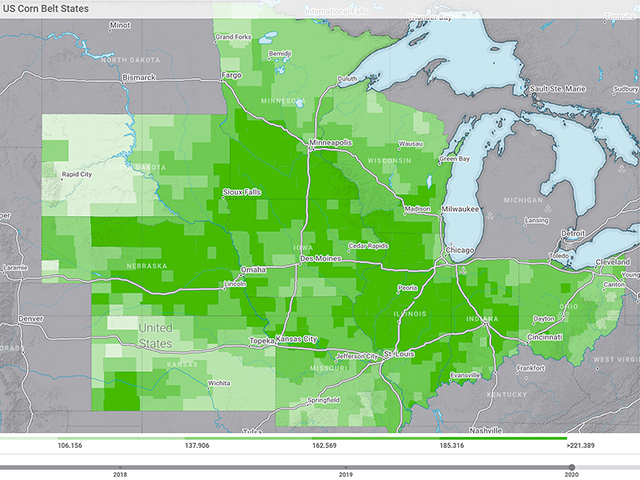
TOUR SCHEDULE
The DTN Digital Yield Tour will begin on Aug. 9 by examining Gro's daily yield estimates in Nebraska and South Dakota. The tour moves into Kansas and Missouri on the tour's second day, and Iowa, Minnesota and Wisconsin on the third. The Eastern Corn Belt takes center stage on Aug. 12, when the tour looks at yield potential in Illinois, Indiana and Ohio. The tour will wrap up with a look at national yield estimates on Aug. 13.
Each day's news articles will include thoughts from Osnato and other experts at Gro, commentary from DTN ag meteorologist John Baranick and insights from farmers across the country.
**
-- DTN/Progressive Farmer 2021 Digital Yield Tour Dates:
Aug. 9: Nebraska, South Dakota
Aug. 10: Kansas, Missouri
Aug. 11: Iowa, Minnesota, Wisconsin
Aug. 12: Illinois, Indiana, Ohio
Aug. 13: National Summary
-- Follow the tour's progress on www.dtnpf.com and on Twitter using the hashtag #dtnyieldtour21
[PF_0821]
(c) Copyright 2021 DTN, LLC. All rights reserved.