

Todd's Take
Time to Get Technical in Corn and Soybeans
As we finish the month of July, it is becoming clear that drought remains a serious threat for U.S. corn and soybean crops in much of the northwestern Midwest and there is not much chance for rain in the forecast for the next two weeks. Traditionally, July is a month of falling prices for corn and soybeans as crops develop toward harvest. But in 2021, prices have yet to make new lows as traders wait for more clues about yield.
For analysts, it is tempting to try to guess yields based on USDA's crop condition ratings; but the world just isn't that easy. For example, USDA's current good-to-excellent rating for corn is 64%, down from 72% at this time a year ago. Does that mean the 2021 corn yield will be below last year's 172.0 bushels per acre (bpa) or will this year's yield be above 2017's 176.6 bpa because the current good-to-excellent rating is above the 2017 rating of 62%? USDA crop ratings are interesting but aren't good proxies for yield.
As I wrote on July 16 (https://www.dtnpf.com/…), the whole topic of "How Much Corn Will China Import?" is another complicated question with lots of moving parts, veiled in a high degree of uncertainty. We could study all the pertinent factors for a long time and never reach a confident conclusion -- there is just so much inside China we don't know.
Outside market risks are another area that can make our brain spin. Here we are over a year from the initial outbreak of COVID-19 and infections are on the rise again in the U.S. and in many of the countries that purchase U.S. grain.
As part of DTN's market analysis team, I don't discount the importance of good fundamental information. We work hard to help our customers try to understand as much about supply and demand factors as possible. But it is also important to recognize where reliable information stops and uncertainty begins.
At this point in the season, there is still a lot about corn and soybean crops we don't know, but that will soon change as we get closer to harvest. During times like these, the prices of crops themselves can provide valuable clues to help navigate the market's uncertainties.
P[L1] D[0x0] M[300x250] OOP[F] ADUNIT[] T[]
The second half of 2020 was an excellent example of a time when paying attention to the price trend would have paid off big. In August and early fall, it was nearly impossible to figure out where prices were headed. China was actively buying U.S. corn and beans but no one knew just how much they were planning to buy. A simple trend-following approach could have helped producers resist the temptation to sell out early.
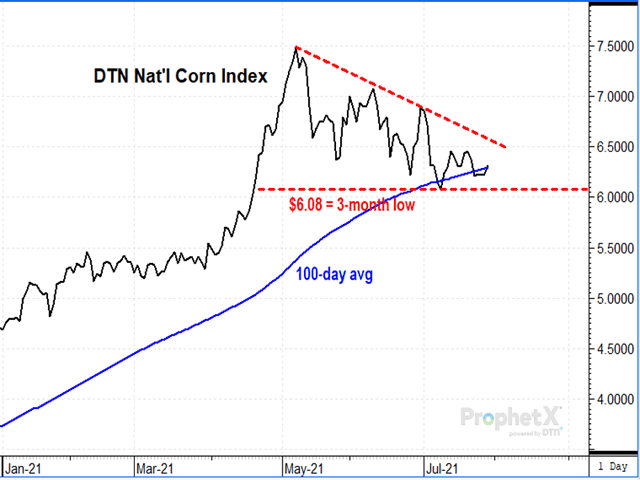
Here in 2021, it may pay again to keep an eye on the trend as both corn and soybean prices have traded in narrower ranges this past month. In the case of DTN's National Corn Index, Thursday's closing price of $6.32 is in a well-defined trading range with a three-month low of $6.08 at the lower end of the range and a downward sloping trendline at $6.61 on the higher end of the range.
Prices are currently biding time as traders watch forecasts and wait for more helpful information.
The more likely direction for corn prices this time of year is down until harvest lows are made, typically around early October. But if the weather stays dry or China starts buying more corn, a breakout above $6.61 would suggest producers have a chance of even higher prices and should stay patient about making sales.
The technical approach is not foolproof and prices can change without warning. USDA's World Agricultural Supply and Demand Estimates (WASDE) reports are known for their share of surprises and the next one is due on Aug. 12. Even so, a simple technical approach can often provide clarity when fundamentals are bogged down in confusion.
For soybeans, DTN's National Soybean Index closed at $14.07 Thursday evening and also finds itself in a trading range. The bias for prices is currently down with resistance at $14.44, the site of the 100-day average. At the lower end of the range, the June low of $12.92 could offer support or signal a fresh break in prices.
A close above $14.44, if it happened, would be most interesting, giving prices more bullish potential than they are currently showing. Fundamentally, a bullish scenario for soybean prices is not out of the question, especially if crop conditions remain dry in August.
For those who would like more guidance on marketing their crops, DTN offers Market Strategies, a six-factor approach that incorporates both fundamental and technical market factors. Corn is currently considered a somewhat bullish market and soybeans are bullish, but we are in a time of year when both assessments could change quickly.
There is still a wide range of price possibilities for both corn and soybeans in 2021, largely depending on weather and on China's behavior. Good fundamental information is important, but we'll never take the uncertainty out of the market. As 2020 reminded us, the market's best clues are often the prices themselves.
**
Comments above are for educational purposes only and are not meant as specific trade recommendations. The buying and selling of grain or grain futures or options involve substantial risk and are not suitable for everyone.
Todd Hultman can be reached at Todd.Hultman@dtn.com
Follow him on Twitter @ToddHultman1
(c) Copyright 2021 DTN, LLC. All rights reserved.