Todd's Take
How Tight Are US Corn Supplies?
Wonders never cease. On Tuesday, May corn closed above $6.00, the first time for a spot contract since 2013. By Thursday, May corn was at $6.50 1/2, held back by Thursday's 25-cent price limit. Even more amazing, it wasn't just the futures price -- cash corn bids at $6 or higher are rapidly blanketing the Midwest.
It was one thing to see $6 bids in Illinois and Indiana, where cash prices are often blessed with generous premiums. By Thursday's close, the entire Midwest was covered with corn bids of $6.00 and higher. A place as far west as Aberdeen, South Dakota, sported a bid of $6.66 per bushel. All of this happened so quickly that, if corn bids were a virus, $6 would be declared the latest variant.
As DTN Farm Business Editor Katie Dehlinger wrote early Tuesday in "Market Approaches $6 Corn" (https://www.dtnpf.com/…), corn supplies have tightened in 2020-21, largely due to China's unexpected demand and early concerns about a dry start to the new season in 2021.
With 2.65 billion bushels (bb) of U.S. corn export sales already on the books, USDA is estimating U.S. ending corn stocks of 1.35 bb for 2020-21, but the rapidly strengthening basis argues for a supply situation that is much tighter.
Historically speaking, cash corn prices near $6 typically accompany an ending stocks-to-use ratio of 7% or less. USDA's current stocks-to-use ratio is at 9.2% and corresponds to cash corn prices near $4.90 per bushel. A 7% stocks-to-use ratio in the current season would put ending stocks near 1.0 bb.
P[L1] D[0x0] M[300x250] OOP[F] ADUNIT[] T[]
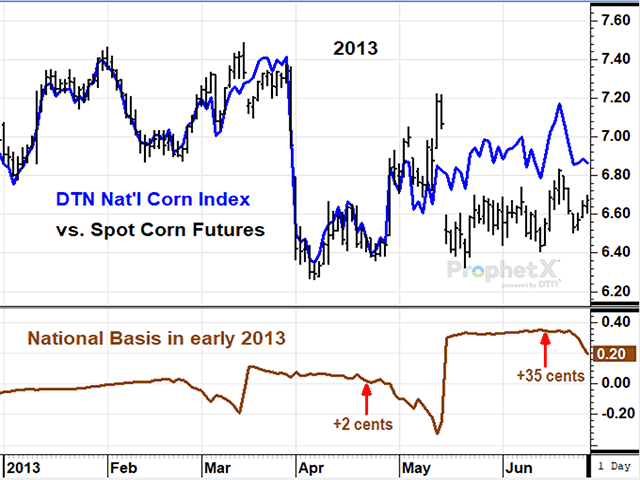
Another argument for tighter-than-estimated corn supplies comes from 2013, the last time the national corn basis was this tight. Using DTN's National Corn Index as a proxy for the national cash corn price, the current national basis is 8 cents below the May futures contract, as of Wednesday, April 21. On April 22, 2013, the national corn basis was 2 cents above the May contract, a little stronger than today's situation.
The interesting thing about the comparison is the 2013-14 season ended with a corn surplus of 821 million bushels (mb) or 7.4% of annual use, much less than the 1.35 bb or 9.2% of annual use USDA currently estimates for 2020-21.
You may recall the last time we had a discrepancy like this was when USDA estimated a 13.69 bb corn crop in January 2020, while strong basis levels argued corn supplies were tighter. A string of less-than-expected grain stocks reports eventually proved the strong basis correct and I suspect that is what will eventually happen in the current situation.
USDA may or may not show a tighter supply situation in the next World Agricultural Supply and Demand Estimates (WASDE) report on May 12, but the important thing to understand is that the new 2021-22 season is likely starting with much less corn than USDA currently estimates.
In 2013, DTN's National Corn Index suffered a drop of roughly $1 per bushel after USDA's Prospective Plantings report, but then rallied to $7.17 a bushel on June 19, posting a national basis of 35 cents over the July contract.
In the current season, there is nothing threatening at the moment to keep cash corn prices from ratcheting higher. Weather, both in Brazil and the U.S., will have much to say about where corn prices go from here and the early outlook for Brazil is leaning dry.
One theme that reemerged last summer is that USDA's WASDE estimates have consistently overstated corn supplies and remain slow to catch up with actual demand. It would be helpful to have monthly grain stocks reports; but until then, we'll continue to track more dependable market clues like basis.
I apologize for repeating myself, but given what markets were facing a year ago, the turnaround in corn prices remains breathtaking. Given this season's larger-than-expected drop in supplies, getting a corn surplus back to 1.50 bb in 2021-22 is looking like a difficult task.
**
Comments above are for educational purposes only and are not meant as specific trade recommendations. The buying and selling of grain or grain futures or options involve substantial risk and are not suitable for everyone.
Todd Hultman can be reached at Todd.Hultman@dtn.com
Follow him on Twitter @ToddHultman1
(c) Copyright 2021 DTN, LLC. All rights reserved.


