DTN Technically Speaking Blog
A Look at Past Soybean Peaks
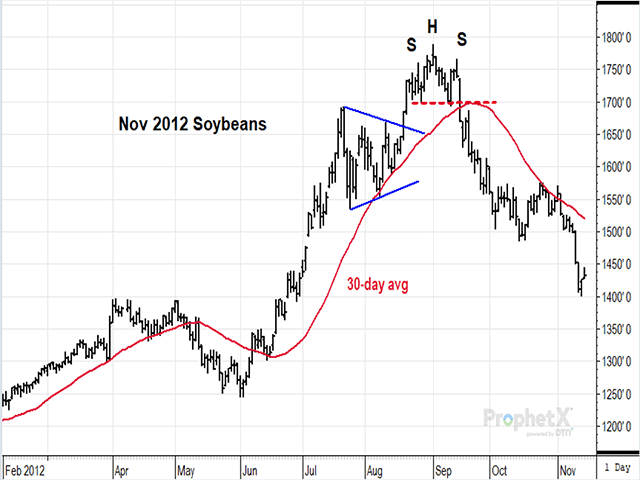
November 2012 Soybeans:
$17.89 on Sept. 4, 2012, marks the all-time high in soybeans and the short explanation is that prices were driven higher by drought. You may be surprised to hear the ending stocks-to-use ratio fell to 4.5% in 2012-13, not as tight as the current estimate of 3.1%. Technically, the rally in November soybeans accelerated from a low of $12.45 on June 4 to the historic peak three months later, holding above the 30-day average on the way up. At one point, prices consolidated within a triangle formation and eventually ended with the formation of a head-and-shoulders pattern -- a classical ending that would not surprise a market technician. On Sept. 17, November soybeans fell to $16.69, below the neckline and below the 30-day average for the first time since the 3-month rally began -- the first technical sign the rally had ended.
November 2008 Soybeans:
$16.36 3/4 on July 3, 2008, was the second highest peak in November soybean history. Higher prices that year were propelled by a major shift of soybean acres to corn as the nation was in the midst of building an ethanol industry in a year that later saw the largest financial meltdown since the Great Depression. The ending stocks-to-use ratio for U.S. soybeans finished 2008-09 at 4.5%, not as tight as soybean stocks are expected to finish in 2020-21. Similar to the price rally described for the peak in 2012, November 2016 soybeans formed a rough version of a head and shoulders formation from June 11 to July 17. The first clear close below the 30-day average was at $14.98 on July 17, but the first close below the neckline was at $14.48 at July 18. At that point, the rally was technically over, and prices fell to a low of $8.25 in October.
P[L1] D[0x0] M[300x250] OOP[F] ADUNIT[] T[]
July 2021 Soybeans:
Unlike the two examples above, we don't yet know what the peak of July soybeans will be or even if the peak of 2021 soybean prices will happen by July. USDA is currently estimating 140 million bushels of ending soybean stocks for 2020-21 or 3.1% of annual use. There is plenty of uncertainty, and it is possible we may be about to experience the tightest soybean situation in U.S. history. Technically, July soybean prices have traded above their 30-day average since Aug. 13, 2021, and show no sign yet of constructing a head-and-shoulders pattern or other kind of top formation. The 30-day average is currently at $12.62 a bushel, well below Friday's closing price of $14.01 (Jan. 15, 2021). Every bull market is different, but so far, this one is not showing a technical sign of being over yet.
Comments above are for educational purposes and are not meant to be specific trade recommendations. The buying and selling of commodities and futures contracts involve substantial risk and are not suitable for everyone.
Todd Hultman can be reached at: Todd.Hultman@dtn.com
Follow him on Twitter @ToddHultman
(c) Copyright 2021 DTN, LLC. All rights reserved.


