Kub's Den
The Rising Tide: Investment Capital Favoring Ag Commodities
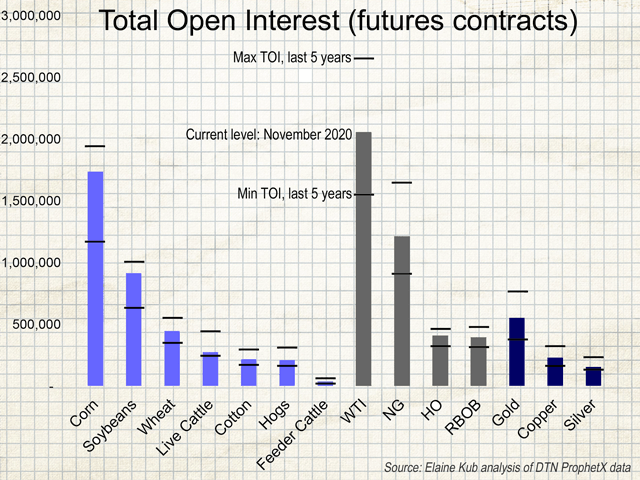
I've been thinking a lot about soybeans lately, and I'm not the only one. Participation in the soybean futures market surged to an all-time high of 1,049,850 contracts (total open interest) on Oct. 21. Traders have taken some profits and pared their positions since then, but total open interest in the soybean market remains at the 95th percentile of anything seen in the past five years.
Not coincidentally, soybean prices are just about the highest they've been in the past five years. High prices seem to attract attention, which seems to boost prices further, and so forth. At $11.75, the continuous front-month soybean chart isn't remarkable from a historical perspective -- not compared to the all-time high of $17.94 3/4 from September 2012 or even the more recent highs of $12.08 1/2 from June 2016 or $15.36 3/4 from May 2014 -- but it's a 45% improvement on the $8.08 low from this April. That's the kind of rally that grabs headlines and attracts speculative investors' money.
Perhaps these investors just don't have anything better to do with their money? Huge pockets of wealth have been created while the U.S. Federal Reserve has loosened monetary policy, and low interest rates have allowed asset prices to shift higher. If an investor put $1,000 into the stock market on Jan. 1, 2019, by today that account would be worth $1,436, give or take some dividends and fees (using the S&P 500 Index as a proxy). What should the investor do with the new $436? Some stock market investors have liabilities they need to pay out (e.g. pensions), but a large portion of stock market investors are already wealthy enough not to need their investment gains for groceries or school supplies, so instead, they just pour the gains into more investments. They buy more stocks, maybe, at relatively high prices or they diversify into other asset classes, such as bonds, real estate or, yes, commodities. There are only so many things an investor can even buy.
P[L1] D[0x0] M[300x250] OOP[F] ADUNIT[] T[]
I wondered if the entire commodity asset class has been affected by a noticeable inflow of investor funds -- was total open interest up for everything, not just soybeans? It turns out, no. Wheat, at around $6 per bushel for the Chicago SRW contract, has a total open interest that's only at the 48th percentile of the participation levels we've seen through the past five years. Corn, like soybeans, is priced about as high as we've seen in recent years, but total open interest in its futures market was much higher last summer and the summer before that. The abandoned lean hog market has lost its attractiveness since the African swine fever headline-grabbing days of last summer and now has total open interest at only the 15th percentile of the past five years.
Moving away from just the agricultural commodities, the granddaddy WTI crude oil futures market is huge -- 2,056,726 contracts of total open interest at last count, but that's a far cry from the record-high 2,662,724 contracts back in May of 2018. Gold, which you'd think would be pretty popular in times of geopolitical instability, is sitting at a relatively high price, $1,887 per ounce, but total open interest in gold futures is at only the 70th percentile of what's been seen in the past five years.
It seems like there is something special about soybeans, even among commodities. Raw numbers of total open interest don't break out the bona fide hedgers from the speculative investors, nor are they adjusted for seasonal hedging patterns (heating oil activity in the winter, commercial grain hedging activity in the summer and fall). But it does seem like soybeans are getting special attention from the investors.
Perhaps we should go back to the idea of high prices attracting attention, attracting higher prices, etc., which is not only a matter of human behavior and excitability, but also a rational reflection of pure arithmetic. Geometric Brownian Motion (GBM) is one common way to mathematically model how asset prices might change over time, named after an 18th century Scottish botanist, Robert Brown, who observed the erratic movements of pollen grains under a microscope. In a GBM mathematical model, the erratic process is calculated as growth over time, plus a random component determined by the asset's volatility (GBM is used in the math behind the Black-Scholes-Merton options pricing model). As the asset prices get relatively higher, the absolute values of the erratic variability get larger and larger. Think of it this way: An erratic 10% move on a $10 asset could be worth $1 of profit, but an erratic 10% move on a $100 asset could be worth $10 of profit. Profit-seeking traders are therefore more attracted to assets with big underlying values that can, if traded correctly, generate big absolute returns. They might prefer to trade $11 soybeans instead of $8 soybeans, just because the next 2% jump will be bigger in absolute dollar terms.
Altogether, then, we can interpret that speculative investment capital might be widely available to flow into all commodities, even the lackluster ones, at the end of 2020, especially as diversified funds rebalance their asset allocations. However, it's the high-priced, exciting ones that will still get the most attention.
Elaine Kub is the author of "Mastering the Grain Markets: How Profits Are Really Made" and can be reached at masteringthegrainmarkets@gmail.com or on Twitter @elainekub.
(c) Copyright 2020 DTN, LLC. All rights reserved.


