

2023 Digital Yield Tour Results
2023 Digital Yield Tour: The Comeback Corn Crop
It went 55 days without rain in parts of McLean County, Illinois, where Jamin Ringger farms.
"In June, we were thinking it was going to be a crop insurance year," he says. It began to rain frequently starting around the end of June, and now he thinks corn will yield above his farm's historical average. "Things have turned around tremendously."
Illinois, like much of the nation's Corn Belt, was pushed to the brink of disastrous drought before rains fueled an astounding comeback. At one point in early June, the U.S. Drought Monitor resembled the notorious drought year of 2012. By mid-August, satellite indicators of crop health were near record.
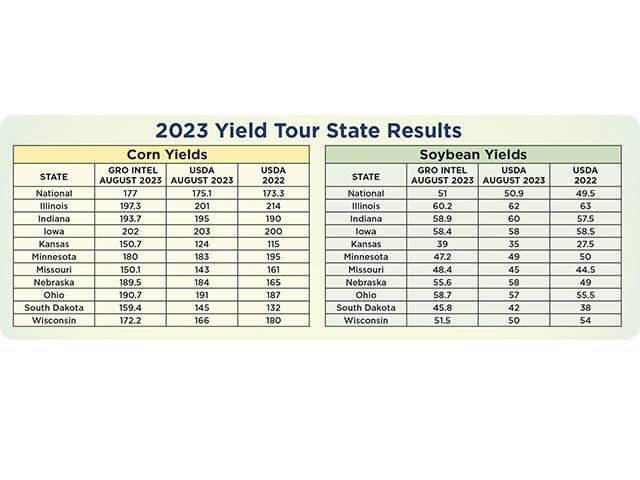
The sixth annual DTN Digital Yield Tour, powered by Gro Intelligence's corn and soybean yield models, examined yield potential in 10 major producing states August 7 through 11, 2023.
Gro Intelligence's yield models use satellite imagery, rainfall data, temperature maps and other data to generate county-level estimates every day as new information becomes available.
Nationally, the tour estimated corn yields at 177 bushels per acre (bpa), which would edge out 2021 for a new national record if realized. Soybean estimates are more average at 51 bpa.
"I'm still a little stunned by how strong the yield estimates have rebounded from the poor early conditions," DTN Lead Analyst Todd Hultman says, adding that "for corn, it appears the market has already thrown in the towel on accepting a big crop, and now I expect new-crop prices to start sliding down the path to harvest lows."
SHORT ON SOYBEANS?
He says Gro's soybean yield estimate could wake up the market to soybeans' bullish price potential. "A 51-bushel-per-acre yield only produces a 4.22-billion-bushel crop, probably not enough to satisfy demand in 2023-24."
P[L1] D[0x0] M[300x250] OOP[F] ADUNIT[] T[]
Soybean yields are also more variable county to county, and with this season's early start to planting, many soybeans sat in dry, cold conditions for long stretches.
"That's the biggest issue I see around here is the stands on beans are not nearly as good as you like to see," southwest Iowa farmer Kevin Ross says. "You know that's going to translate to yield, but every little planting hiccup that you had showed up because it was so dry. You get forgiven for a lot of that stuff when you get moisture, but we didn't have that."
SPORADIC RAINFALL
Gro Intelligence Senior Analyst Jon Haines says soil moisture is a determining factor in the outcome of this year's crops. Even after July's abundance of precipitation, levels were so depleted that crops were living drink to drink.
"We know we started this season with a lot of stress. Even more than normal, it's about where it did rain and where it didn't," he says. Gro's county yield maps show a patchwork of yield possibilities, with some of the highest- and lowest-yielding counties within short distance of each other.
DTN Ag Meteorologist John Baranick says this summer's rainfall has been hard to predict. Rather than soaking systems that drench a widespread area, this summer's rain came from thunderstorms.
"Rain came more in streaks and bursts, so some areas have been missed, though that is typical of a summer season anyway," he says. "If you're having problems on your farm or in your area, or the reverse, that doesn't mean that the rest of the country is seeing the same things."
Gro Intelligence Senior Analyst Will Osnato says July's rainfall cooled off temperatures, which also had risen precipitously in June. The result was a greatly improved normalized difference vegetation index, more commonly referred to as the NDVI, which measures the color of a crop from satellites and compares it to more than 20 years of historical data. Generally, a greener map reflects a healthier crop.
"We already had a fast-growing crop with the high temperatures of June, then we got a bunch of rain," he says, adding the NDVI levels are the fourth highest in 20 years of data. NDVI is a large component of Gro's yield model.
VALUABLE LESSONS
DTN's Hultman says this year's Digital Yield Tour helped put the U.S. Drought Monitor in perspective. The weekly update uses a lot of data but also has a subjective element. It's great for telling the longer term, ecological story of drought. However, he thinks in the future, he will pay more attention to NDVI to see how plants respond to conditions on the ground.
"I still have to wonder if early stress took off more corn yield than models indicate," Hultman adds. "No matter how yields turn out, we're all going to learn something valuable from this unusual year of weather."
**
FOR MORE INFORMATION:
-- Review the tour's findings on https://www.dtnpf.com/… and on X using the hashtag #dtnyieldtour23
-- Digital Yield Tour: https://spotlights.dtnpf.com/…
-- Read Katie's business blog at https://about.dtnpf.com/…
-- You may email Katie at katie.dehlinger@dtn.com, or visit @KatieD_DTN on X.
[PF_0923]
(c) Copyright 2023 DTN, LLC. All rights reserved.