
High-Altitude Assessment
Technology - High-Altitude Assessment
There is an overused phrase in business circles: the 30,000-foot view. It means to see all the combined aspects of a situation, the big picture.
Nate Douridas doesn't need to get a view from that high an altitude to help make assessments. Photos from about 2,500 feet usually do the trick. Several types of images taken from a Piper single-engine airplane inform decisions great and small about the soil and the crops growing on the 2,100-acre farm he manages for Ohio State University, at the Molly Caren Agricultural Center, London, Ohio.
The university-owned farm, site of the annual Farm Science Review farm show, may be demonstration and research-oriented, but the farming operation itself has to pay its own way. Aerial imagery of the fields helps the staff make bottom-line decisions.
"We've used the imagery in most instances to evaluate the extent of seasonal and pinch row compaction in corn, and also to determine the need, if any, for in-season and late-season nitrogen applications on corn," Douridas explains. In addition, the farm's managers and researchers are learning the value of thermal images that show the relative heat of crop vegetation, which can be an early indicator of disease pressure.
IMAGES DRIVE DECISIONS
Tom Uthell has been using aerial images taken from manned airplane flights to help check on the health of his crops, near Effingham, Illinois, since 2009. "These images can help make a diagnosis in real time -- we can scout according to what we see," he says.
"Basically, what we've done initially is used images to identify areas that need to be tiled," Uthell says. "We've added 15 bushels per acre [corn] in those areas as a result, and we've also used the images to work on surface drainage."
Uthell had been receiving images and analysis provided through FARMserver, the web-based data-analysis tool offered by Beck's Hybrids. Images from manned flights were discontinued for this program in early 2019, but drone images are still available. The images Uthell received are known as NDVI, or normalized difference vegetation index. These field pictures provide information from a combination of regular aerial photos and near-infrared (NIR) images (see "What Kind of Pictures Do You Want?", on page SM-6).
The NDVI imaging helps him identify other problems beyond drainage. "We never know what yield-limiting factor is going to rise up from year to year," says Uthell, himself a Beck's dealer. "Potentially, we have the technology to use the images to create spot spray maps for herbicide application and avoid having to spray an entire field." Likewise, the images can help identify areas of disease pressure such as gray leafspot and Northern corn leaf blight.
Douridas, at the Molly Caren Agricultural Center, has worked with several providers of aerial images over the years but, most recently, has used AirScout, founded by fifth-generation Indiana farmer and airline pilot Brian Sutton.
P[L1] D[0x0] M[300x250] OOP[F] ADUNIT[] T[]
GREATER DETAILS
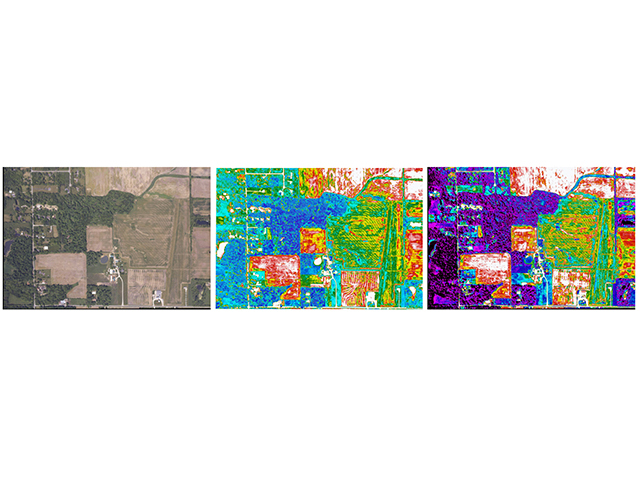
AirScout uses its own proprietary imaging, known as advanced difference vegetation index (ADVI) to give customers even more detailed information on their fields. Whereas industry standard NDVI images produce field maps in a three-color interpretation, ADVI produces images with a multitude of colors, giving farmers even more specificity -- more zones within zones. The photography is shot from a single-engine prop airplane every 10 to 14 days but more often during rapid-growth periods. The cost is $7 per acre for the entire season and all use of AirScout's online tools.
The ADVI images have been invaluable to Douridas. "We've been able with ADVI to clearly see the difference in nitrogen treatments in fields, including preplants and early sidedress," he says. "The ADVI map can help guide later-season applications, if needed."
ADVI is the result of Sutton being unsatisfied with the level of precision offered by existing aerial photography to base field prescriptions. In 2010, using a thermal infrared camera, he found part of what he wanted. Those images coupled with an algorithm for data analysis are the foundation for AirScout's ADVI. These images can interpret field needs from images of bare soil without having to wait until there is a green canopy, Sutton explains.
"NDVI just works with the green canopy and ignores bare soil," he says, "which is really where this all starts. ADVI can amplify shades of green but also shades of brown." This ability allows him to use information from the soil shots to factor into the needs of a field.
NDVI and ADVI are only part of what Douridas pays attention to at the Molly Caren farm. As a season advances, he also looks at thermal images of the field that indicate areas of higher temperature.
"There can be some kind of disease pressure, like gray leafspot or Northern corn leaf blight, that corresponds in some way to an elevated temperature reading," Douridas says. The elevated temperatures can be an indicator that disease is present.
"In a 100-acre field, we can otherwise miss a zone of disease presence building," he says. Knowing exactly where a disease might be building is important when you may have to make a $30-per-acre decision on fungicides.
The use of aerial imaging, in general, is on the rise, particularly with access to purchasing and using drones. Satellite images are still in use and can provide cost-effective information when cloudy weather and availability aren't hampering the effort.
"I see a mix of all of these being useful," says Dennis Bowman, an Extension educator with the University of Illinois. He's using a grant to research the use of robotics on the ground in conjunction with information from drones. "Some of the best work right now is coming out of the aerial platforms. Timing and weather can cause issues with satellites -- an airplane is better for just-right timing. But, there is nothing quite as on-demand as having a drone of your own."
Many producers have opted to use services such as Ceres, TerrAvion, GeoVantage or AirScout so they can access experts to execute and interpret the shots from manned flights.
One of the biggest things the images do for someone like Douridas is save time. "Imagery allows us to focus on areas of the farm and fields that need our immediate attention," Douridas explains. "Drainage improvements is a good long-term example. Rather than walk across a 150-acre field and 'hope' you cover the most important places is now made more efficient with targeted scouting."
What Kind of Pictures Do You Want?
Crop aerial imaging is generally delivered in three different ways: drones, airplanes or satellite. The kind of image you need or want depends on your needs and circumstances.
The five image types are:
> Aerial View. This is essentially what we would think of as a regular photo -- using the red, green, blue spectrum (RGB) -- shot from a specific altitude.
"These are the most important pictures," AirScout's Brian Sutton says. "They get you 75% of the way to your goal line." The other image types, NDVI, ADVI, NIR and thermal, give additional information to layer with the basic visual image.
> Near-Infrared (NIR). NIR images show the reflectiveness of vegetation. Brighter red areas indicate more vegetation. NIR images show color bands outside of what the human eye can see. These images can show response to damage or disease before the same detail could be seen in the RGB images.
> Normalized Difference Vegetation Index (NDVI). This is a multispectral image that combines the normal color spectrum seen via aerial views along with NIR images. This type of image shows a crop's potential health based on a mathematical interpretation of color and near-infrared data. A color gradient is applied to make the image easier to interpret. Most commonly, red is used to designate low vegetative values and green being high.
> Advanced Difference Vegetation Index (ADVI). Specific to AirScout, ADVI uses the data already available in digital photographs and applies particular algorithms to generate even more detailed zones within a field.
> Thermal. These images measure what is known as long-wave radiation. In the case of crops, it measures waves emitted by plants in a range far beyond what can be visibly seen. Because these images measure what is being "emitted" rather than "reflected," thermal works at night when no light is present. Thermal images can indicate crops that are too wet or too dry.
[PF_1220]
(c) Copyright 2020 DTN, LLC. All rights reserved.