

2023 DTN Digital Yield Tour -- National
US Average Corn Yield 177 BPA, Soybeans 51 BPA, DTN Digital Yield Tour Finds
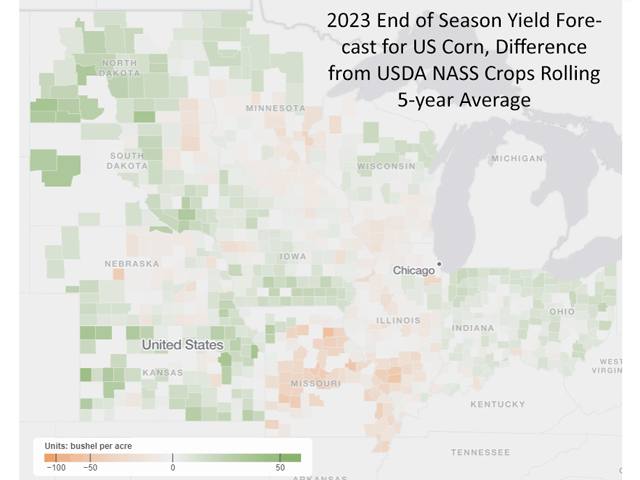
MT. JULIET, Tenn. (DTN) -- The 2023 DTN Digital Yield Tour, powered by Gro Intelligence, finds a corn crop that's rebounded so remarkably from an early season drought that it could flirt with a new national average record. A healthy soybean yield estimate has potential for improvement if the weather forecast comes true.
Now in its sixth year, the DTN Digital Yield Tour takes an in-depth look at how this year's corn and soybean crops are progressing using Gro's daily yield models, which are generated with satellite imagery, rainfall data, temperature maps and other data. The tour begins with a look at the national yield estimates before examining 10 key states in detail throughout the week.
On Monday, Aug. 7, Gro's corn yield model forecast a 177-bushel-per-acre (bpa) national average corn yield. If realized, it would steal the record from 2021's 176.7 bpa national average.
The soybean forecast is 51 bpa, just shy of USDA's July estimate of 52 bpa. The National Agricultural Statistics Service releases its first survey-based yield forecast of the season Friday.
"I'm still a little stunned by how strong the yield estimates have rebounded from the poor early conditions seen in late June, but I have also witnessed a lot of areas in the Western Corn Belt where crops do look very good after a tough start," DTN Lead Analyst Todd Hultman said.
"For corn, it appears the market has already thrown in the towel on accepting a big crop, and now, with more rain in this week's forecast, I expect new-crop prices to start sliding down the path to harvest lows," he said.
While Gro's 51-bpa estimate may initially sound bearish after the year's dry start, it "could wake the market up to soybeans' bullish price potential. A 51-bushel-per-acre yield only produces a 4.22-billion-bushel crop, probably not enough to satisfy demand in 2023-24," Hultman said.
P[L1] D[0x0] M[300x250] OOP[F] ADUNIT[] T[]
After two hot and dry months in late spring and beginning of summer, the U.S. Drought Monitor started drawing comparisons to 2012, Hultman said. Farmers posted bleak pictures on social media. Then, on June 28, a derecho swept through, marking the change to an El Nino weather pattern marked by average temperatures and many chances for rain.
"Heavy rain finally fell over a widespread area in the deepest drought at the time and kicked off a pattern of very good rainfall for July," DTN Ag Meteorologist John Baranick said. "Rain came more in streaks and bursts, so some areas have been missed, though that is typical of a summer season anyway. It's just coming on the back of really dry weather from mid-May to mid- to late-June, so the crop hasn't had the subsoil moisture to rely upon this season."
Gro Intelligence Senior Analyst Will Osnato said July's rainfall cooled off temperatures, which had also risen precipitously in June. The result was a greatly improved normalized difference vegetation index, more commonly referred to as the NDVI, which measures the color of a crop from satellites and compares it to more than 20 years of historical data. Generally, a greener map reflects a healthier crop.
"We already had a fast-growing crop with the high temperatures of June, then we got a bunch of rain," he said, adding the NDVI levels are the fourth highest in 20 years of data. NDVI is a large component of Gro's yield model, and Osnato said it's one of the big data points in favor of a higher national corn yield estimate.
Drought is also a critical element in Gro's models. While NDVI focuses on plant health, drought measurements rely on precipitation data as well as other data such as streamflow and soil moisture. Osnato said it's one of the factors that's negatively affecting the model.
Hultman said people that follow the U.S Drought Monitor closely would probably underestimate the amount of improvement in the crop, adding, "NDVI tells a more detailed story."
Baranick said drought remains the baseline, and much of the crop is living drink-to-drink.
"Drought has certainly had an impact on the crop this year. If it wasn't there, there is no doubt in my mind that we'd be seeing record yield forecasts. But that's weather for you," Baranick said.
While drought conditions draw the main spotlight, it's far from the only issue this year. A lingering cold spell last spring got a lot of soybeans off to a slow start, especially for southwest Iowa farmer Kevin Ross's no-till soybeans.
"That's the biggest issue I see around here is the stands on beans are not nearly as good as you like to see," he said. "You know that's going to translate to yield, but every little planting hiccup that you had showed up because it was so dry. You get forgiven for a lot of that stuff when you get moisture, but we didn't have that."
You can watch an update from Kevin Ross's farm here: https://www.dtnpf.com/….
There are still pockets of the country that missed out on the rain, or have not gotten enough, and that's showing up in some lower-than-average state yield estimates. We'll look at these areas as the DTN Digital Yield Tour continues. On Tuesday, our reporting will feature the Eastern Corn Belt states of Ohio, Indiana and Illinois. Wednesday's focus will be Wisconsin, Nebraska and Iowa, where the hit-and-miss nature of storms shows up. Kansas and Missouri take center stage on Thursday where we'll examine the divergence in those states' fortunes. And on Friday, we'll look to the north for details on Minnesota, South Dakota and North Dakota.
We also invite you to attend a free webinar about the Digital Yield Tour on Tuesday, Aug. 15. DTN Farm Business Editor Katie Dehlinger will be joined by researchers from Gro Intelligence to dig deeper in the data behind the Digital Yield Tour and answer your questions. The webinar will also include segments from DTN Ag Meteorologist John Baranick on the long-range forecast and by DTN Lead Analyst Todd Hultman on the outlook for the grain markets. Register here: www.dtn.com/agsummit.
For more information, including previous stories, videos and other content, visit https://spotlights.dtnpf.com/….
Katie Dehlinger can be reached at katie.dehlinger@dtn.com
Follow her on Twitter at @KatieD_DTN
(c) Copyright 2023 DTN, LLC. All rights reserved.

