

USDA Breaks Down Farm Expenses
As Farmers Know, Production Costs Were Higher in 2022 -- Especially for Livestock Producers
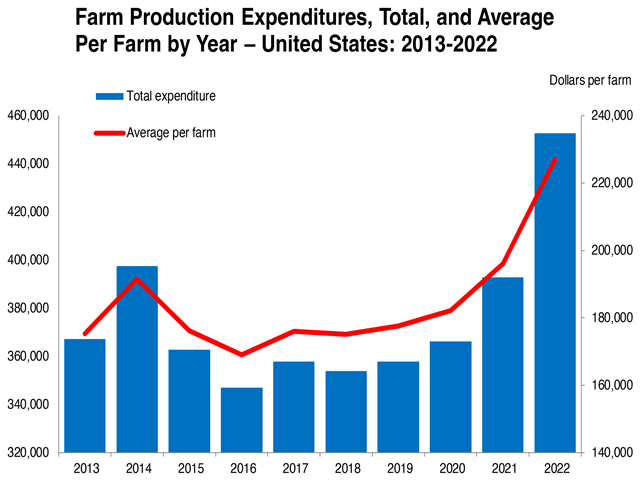
OMAHA (DTN) -- Farm production expenses jumped more than 15% in 2022 with increases in every area tracked by USDA, according to a new report from the National Agricultural Statistics Service.
Farm expenses hit $452.7 billion in 2022, up from $392.9 billion in 2021.
The higher production costs fell the hardest on livestock producers. Feed costs were the largest overall driver of higher expenses, up 18.5% from 2021. Other "farm services" rose 10.8%, while livestock, poultry and related other expenses were up 10.1%. Labor costs were 9.2% higher.
The total farm expenditure per average farm in 2022 was $226,986, up 15.8% from $196,087 in 2021.
LIVESTOCK COSTS UP 18.1%
Livestock farms saw expenses increase 18.1% in 2022 to $218.9 billion. Feed topped the expenses at $81 billion, while other livestock, poultry and related expenses were $43.2 billion, and farm services were $20 billion. The average total expense for a livestock farm was $200,359.
CROP EXPENSES UP 12.6%
Crop farm expenses were $233.8 billion, up 12.6% from 2021. Farmers spent $31.9 billion on fertilizer, lime, and soil conditioners; $29 billion on labor; another $28.6 billion on farm services; and $26.7 billion on rent. Combined crop inputs -- chemical, fertilizers and seeds -- cost $73.4 billion, or 31.4% of total expenses.
P[L1] D[0x0] M[300x250] OOP[F] ADUNIT[] T[]
FUEL AND FERTILIZER
Total fuel expenses were $17.4 billion nationally. That includes $11.4 billion in diesel costs, which were $35.4% higher than 2021. Gasoline costs were $3 billion, up 22.2% from 2021. LP gas was $2 billion on costs, up 41%.
Fertilizer, lime, and soil conditioner costs topped $36.8 billion for the year, up $7.3 billion from 2021, or 19.8% higher. Farmers in Midwestern states accounted for $15.8 billion in fertilizer costs, about $4 billion higher than 2021. Nationally, fertilizer accounted for 8.1% of total expenses.
Fertilizer costs have been coming down over the past year as the DTN Retail Fertilizer Trends column highlights. See https://www.dtnpf.com/….
HIGHEST FARM EXPENSES IN FIVE STATES
California had the highest expenses of any state in the country at $46 billion. Labor made up the biggest expense for farmers in the state at $12.36 billion.
Iowa came in second with farm expenses at $35.68 billion. Feed was listed as the largest expense at $7.9 billion. Other livestock-related expenses came in at $5.3 billion. Rent topped $4 billion.
Texas was third with expenses at $29.87 billion. Feed costs were the largest expense in Texas at $6.2 billion, while other livestock-related costs were $5.7 billion.
Nebraska was fourth with expenses listed at $28.53 billion. Livestock-related expenses were $6.7 billion with feed costs at $4.5 billion. USDA shows rent costs in Nebraska declined $50 million to $2.92 billion.
Kansas was fifth with expenses at $24.69 billion. Livestock-related expenses topped $7.1 billion with feed costs at $5 billion. Rent expenses in Kansas dropped to $1.41 billion from $2.1 billion in 2021.
LARGEST FARMS EQUAL LARGEST EXPENSES
While the average cost per farm was $226,986, nearly 62% of costs involved farms with $1 million in sales or higher.
Farms with sales from $1 million to $4.99 million accounted for 32.9% of farm expenses, or an average of $2.16 million in costs per farm. They made up the largest overall segment of farms with $149 million in overall expenses. Their average costs rose more than 18% over the year. Feed costs rose $6.8 billion for these producers. Fertilizer costs were up $3.2 billion, and labor costs also rose $2.9 billion.
Farms with sales topping $5 million accounted for 28.9% of all expenses, but their average expenses topped $14 million per farm. These farms accounted for $130.77 million in expenses. Their costs rose an average of 10.5%, year-over-year. Feed costs rose $7.4 billion. Fertilizer costs were up $800 million. Agricultural chemicals were up $600 million. Surprisingly, labor costs for the largest farms only rose $200 million to $17.7 billion.
For the full NASS expense report, go to https://release.nass.usda.gov/….
Chris Clayton can be reached at Chris.Clayton@dtn.com
Follow him on Twitter @ChrisClaytonDTN
(c) Copyright 2023 DTN, LLC. All rights reserved.

