

2022 DTN Digital Yield Tour -- IL IN OH
Eastern Corn Belt Corn Yields Are the Best in the Country, but They're Average
ANKENY, Iowa (DTN) -- Cooler midsummer temperatures and beneficial rains are showing up in promising corn and soybean yield estimates for Illinois, Ohio and Indiana during Day 2 of the DTN Digital Yield Tour, powered by Gro Intelligence.
"I think the Eastern Corn Belt is definitely the standout (region) this year in terms of (crops) looking pretty good," said Gro Senior Analyst Jon Haines.
The DTN Digital Yield tour, now in its fifth year, takes an in-depth look at how this year's corn and soybean crops are progressing using Gro's real-time yield maps. Yield projections are generated by using satellite imagery, rainfall data, temperature maps and other public data. Gro's yield estimates are updated daily on a county and state level, so numbers at publication time may be different than what you find on its website.
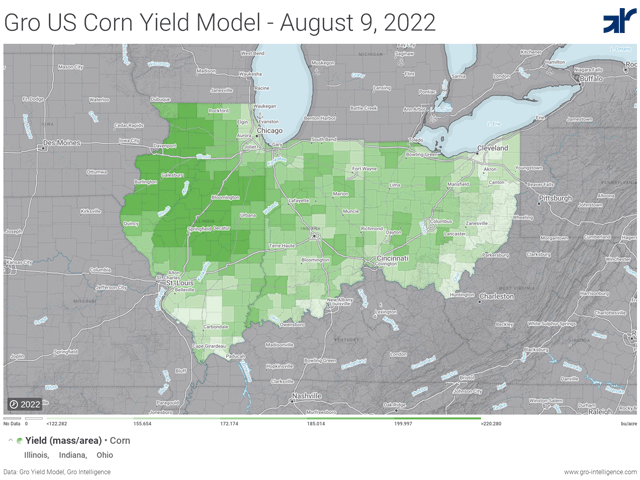
On Tuesday, Aug. 9, Gro's yield models show the Eastern Corn Belt states of Illinois, Indiana and Ohio are at or near each state's five-year average yield compiled by USDA. Gro projects Illinois corn and soybean yields at 196.9 bushels per acre (bpa) and 60 bpa, respectively. Both numbers are only 0.1 bpa from average.
For Indiana and Ohio, Gro's average corn and soybean yield estimates range from 0.5 to 3.1 bpa less than five-year averages. Gro pegs Indiana corn and soybean yields at 180.9 bpa and 54.5 bpa, respectively. Ohio corn is projected to average 178.9 bpa, and soybeans are estimated at 51.8 bpa, according to Gro.
"Overall, Gro's estimates are pretty close to (trade) expectations," said DTN Lead Analyst Todd Hultman, referring to yield estimates for the three Eastern Corn Belt states. "This is like the most protected, sheltered part of the country from adverse weather conditions."
DTN Ag Meteorologist John Baranick said that, in general, most of Illinois, Indiana and Ohio have had adequate rain and experienced the normal number of days with temperatures in the 90s during the critical pollination and the ongoing grain-fill period. This hasn't hurt crop development in the region unlike in many parts of the Western Corn Belt, which has experienced dry conditions and extreme heat.
"I think we have the least concern over those three states (Illinois, Indiana and Ohio) than anywhere else," Baranick said.
One of the key components of Gro's yield models is the normalized difference vegetation index, more commonly referred to as the NDVI, which measures the color of a crop from satellites and compares it to more than 20 years of historical data. Generally, a greener map reflects a healthier crop. You can see the NDVI map for Illinois, Indiana and Ohio here: https://app.gro-intelligence.com/….
To see Gro's yield models and explore county-level detail for each state, go to:
-- Illinois: https://app.gro-intelligence.com/…
-- Indiana: https://app.gro-intelligence.com/…
-- Ohio: https://app.gro-intelligence.com/…
Gro's yield projections for the three Eastern Corn Belt states are significantly higher than the national averages of 167.2 bpa for corn and 48.9 bpa for soybeans. Find DTN's story about the national findings at https://www.dtnpf.com/….
For your convenience, links to all the stories, maps and videos from the tour can be found at https://spotlights.dtnpf.com/….
ILLINOIS
Corn: 196.9 bpa
-- USDA 5-year average: 197 bpa
-- High: Logan County, 216.8 bpa
-- Low: Hardin County, 147.2 bpa
Soybeans: 60 bpa
-- USDA 5-year average: 59.9 bpa
-- High: Moultrie County, 69.6 bpa
-- Low: Randolph County, 41.97 bpa
Gro Comments:
-- Gro Intelligence Senior Analyst Mintak Joo said Illinois' corn yield is trending right at the 5-year average but adds that it's a healthy average.
P[L1] D[0x0] M[300x250] OOP[F] ADUNIT[] T[]
"That includes some record yields," Joo said, pointing to Illinois' state average record of 210 bpa set in 2018 and last year's 202-bpa-average yield. "So, it's looking pretty good."
While a large portion of central Illinois boasts county yield averages above 210 bushels, there are places that are struggling, Haines said.
"The areas that are closer to Iowa aren't as good," he said, adding that the northwestern portion of the state has produced well in recent years. The southern portion of the state is struggling too, with the lowest-yielding county for corn bordering Kentucky and soybeans bordering Missouri.
Weather Comments:
-- "In Illinois, it is not surprising that this state is sitting right about normal for yields," Baranick said. "While there was a drier period in June, rains since then have been pretty well spread out. The heat has been something regular, though, especially toward the Mississippi River. Yields lower than last year make sense in that account."
"And yields above average across the north aren't surprising either. This area had been in drought the past couple of years but not this year," he continued. "Precipitation has been excellent. It appears that the higher yields in the north are offsetting some of the lower yields due to heat in the south and west."
Farmer Comments:
-- Reid Thompson's farms span 40 miles of McLean and Ford counties in central Illinois. It seems they've had a little of everything. Hail damage on corn here. Replanted soybeans there. But overall, plant health is good and insect and disease pressure slight.
Thompson expects the farm's average yield to be higher than his actual production history, or APH, and said that fields with consistent stands are outperforming others. Cool, wet conditions spread planting out across the first few weeks of May, and earlier-planted corn benefited from better weather at pollination.
Thompson estimated that a field planted May 15 would yield somewhere around 230 bpa to 240 bpa. "It has a long way to go. It just pollinated," he said, noting aborted kernels on a sample ear. "I'm not upset. We have a long grain-fill period ahead of us."
Illinois' yield maps: https://app.gro-intelligence.com/….
INDIANA
Corn: 180.91.4 bpa
-- USDA 5-year average: 184 bpa
-- High: Benton County, 194.9 bpa
-- Low: Crawford County, 152.7 bpa
Soybeans: 54.5 bpa
-- USDA 5-year average: 56.2 bpa
-- High: Tipton County, 62.8 bpa
-- Low: Warrick County, 42.2 bpa
Gro Comments:
-- Haines said one of the biggest influences on Indiana's yield potential is the abnormally dry conditions across the northern half of the state. For the past two seasons, counties in west-central Indiana usually pulled in 200-plus bpa, on average. This year, no single county tops 200 bpa.
"I think one thing we are seeing in terms of the shift in the model over the past week, Indiana's probably benefited more than some of the other areas," Haines said. Over the past two weeks, Indiana's corn yield estimate has climbed by nearly 10 bpa as weather forecasts showed lower temperatures and continued rainfall changes.
Weather Comments:
-- "Early on in the summer, a lot of these areas in the Eastern Corn Belt went through a period of dryness, or flash drought started poking up," Baranick said. "And it's been harder to get rid of that in Indiana than it has in Ohio or Illinois. So, there are more areas that are drier. There's a section in central Indiana that's been super dry, even though it hasn't really shown up that great on the Drought Monitor. It just keeps getting missed. So, I think a lot of the better spots in Indiana are getting more missed than hit (with rainfall) like they are in Illinois."
Since Indiana farmers planted in a timelier manner than their neighbors, the crop is a little further along development-wise. "So, when that dryness occurred in June, it was a little more detrimental than it would have been in Ohio or Illinois," Baranick said.
Indiana's yield maps: https://app.gro-intelligence.com/….
OHIO
Corn: 178.9 bpa
-- USDA 5-year average: 178.4 bpa
-- High: Clinton County, 194.6 bpa
-- Low: Belmont County, 122.3 bpa
Soybeans: 51.8 bpa
-- USDA 5-year average: 53.2 bpa
-- High: Darke County, 56 bpa
-- Low: Cuyahoga County, 37.08 bpa
Gro Comments:
-- Haines said yield estimates have remained fairly consistent in Ohio the past few weeks. A derecho (a weather event that resembles an inland hurricane) hit the northern half of Ohio in early June, but didn't cause much, if any, damage to crops.
"It's generally been pretty good," Haines said. "In the northwestern areas of Ohio, that is the best in term of the Gro yield models."
Weather Comments:
-- "Planting was delayed significantly due to wet and cool conditions, and I heard many reports of folks concerned about getting planted at all," Baranick said. "It appears they did get crops in eventually, and when they did, conditions have been quite favorable overall. Ohio hasn't been nearly as hot as farther west, and rains have been fairly consistent without being overly intense, for the most part. Ohio's yield estimate for soybeans is a bit lower than I might expect given the consistently good soil moisture across the state. I'm not sure what is contributing to that. Conditions seem to be really good for both corn and soybeans."
Farmer Comments:
-- Glen Newcomer farms near Bryan, Ohio, in the northwest corner of the state. He said crop development varies greatly across the state due to delayed planting. Newcomer started planting on May 10 and finished on June 5.
Torrential rains caused many farmers in northwest Ohio to replant half their soybeans acres, the seed dealer said. On Newcomer's farm, 5% of soybean acres needed to be replanted.
After a trying start, Newcomer said, the growing season has been good. However, he continued, an early frost would curtail yields due to an expected late harvest.
"Generally speaking, the crops are in good condition. But they're variable and delayed," Newcomer said. "It's very difficult to estimate what that final yield is going to be in our state because of that. The importance of rains for the next six week is truly going to determine our crop."
Ohio's yield maps: https://app.gro-intelligence.com/….
Matthew Wilde can be reached at matt.wilde@dtn.com
Follow him on Twitter @progressivwilde
Katie Dehlinger can be reached at katie.dehlinger@dtn.com
Follow her on Twitter @KatieD_DTN
(c) Copyright 2022 DTN, LLC. All rights reserved.

