

2022 DTN Digital Yield Tour -- National
U.S. Average Corn Yield at 167.2 BPA, Soybeans at 48.9 BPA, Tour Finds
MT. JULIET, Tenn. (DTN) -- The 2022 DTN Digital Yield Tour, powered by Gro Intelligence, finds a corn crop that's poised for success in the east, but struggling with oppressive heat and sporadic rain patterns in the west. Springtime's messy fingerprints are everywhere, especially national corn and soybean yield estimates.
Now in its fifth year, the DTN Digital Yield Tour takes an in-depth look at how this year's corn and soybean crops are progressing using Gro's real-time yield maps, which are generated with satellite imagery, rainfall data, temperature maps and other public and private data. Unlike previous years, the 2022 tour begins with national yield estimates and will examine crop prospects in 10 major growing states throughout the week.
On Monday, August 8, Gro's corn yield model forecasts a 167.2 bushel-per-acre national average corn yield and a 48.9 bpa soybean yield. Unlike static estimates, Gro's yield projections update daily on a county and state level, so the numbers at publication time may be slightly different than what you find on Gro's displays, which you can access as an exclusive perk of the DTN Digital Yield Tour. (You can see the yield estimates here: https://app.gro-intelligence.com/…)
"Gro's yield estimates are lower than expected and lower than most private estimates at this time," DTN Lead Analyst Todd Hultman said. USDA used a yield of 177 bpa in July to underpin its 14.5-billion-bushel production estimate. USDA will release its updated yield projections on Friday at 11 a.m. CT, but that report will only incorporate farmer survey data.
"Crop development is in an earlier stage than usual this year, and next month's numbers will likely be more important," Hultman said. "Even so, I think Gro makes a good case to expect USDA to lower its corn and soybean yield estimates by the September report, when field data is included." DTN will follow up with Gro in early September to see how its models change during August.
Gro Intelligence Senior Analyst Will Osnato said the national corn and soybean yield models are on the lower side of most early estimates, but they're trending upwards. Since DTN's preview article last week, Osnato said the model's corn yield estimate shifted higher to reflect the cooler-than-expected conditions. (You can read it here: https://www.dtnpf.com/…)
The uptick in the yield estimate might be the incorporation of a new reading of the normalized difference vegetation index, more commonly referred to as the NDVI, which measures the color of a crop from satellites and compares it to more than 20 years of historical data. Generally, a greener map reflects a healthier crop.
But sometimes, that greenery can be tricky. This year's crop is delayed compared to average, and in the data, that could mean the seasonal trend that shows when NDVI values typically hit their peak could be off by a few weeks, which could influence Gro's yield model.
Osnato said a shift in the 7-day forecast is also driving an upward turn in the yield model.
"We've got a change in the upper air pattern for next week in particular," DTN Ag Meteorologist John Baranick said. "There's an east-west disparity in it. The Eastern Corn Belt looks a lot cooler now than the western half, and we've got a cold front coming in later this week that's really going to drive that. The Dakotas, Nebraska and Kansas all had above normal temperatures, and they still look like they're going to have above normal temperatures."
P[L1] D[0x0] M[300x250] OOP[F] ADUNIT[] T[]
While the big picture points to another tale of east vs. west, Baranick said that's not the whole story. The weather has been so variable that even states with strong overall yield potential will have pockets that buck the narrative. "
Dave Walton farms in one of this year's garden spots -- east central Iowa. The grain and livestock farmer, who farms near Wilton, said timely rains have helped his crops flourish despite a recent week of extreme heat (temperatures near 100 degrees Fahrenheit). Wilton planted about two weeks later than he wanted, finishing up corn and soybeans by mid-May, but yield potential looks promising.
Insect and disease pressure has also been light, Walton said. He predicts corn and soybean yields will meet and likely exceed recent annual production history (APH) of about 240 bushels per acre for corn and about 65 bpa for soybeans in most fields.
Walton talks to farmers across the state and country through his roles with the Iowa Soybean Association and American Soybean Association.
"It sounds like our spot in eastern Iowa … and western Illinois … is probably as good as it is anywhere in the country."
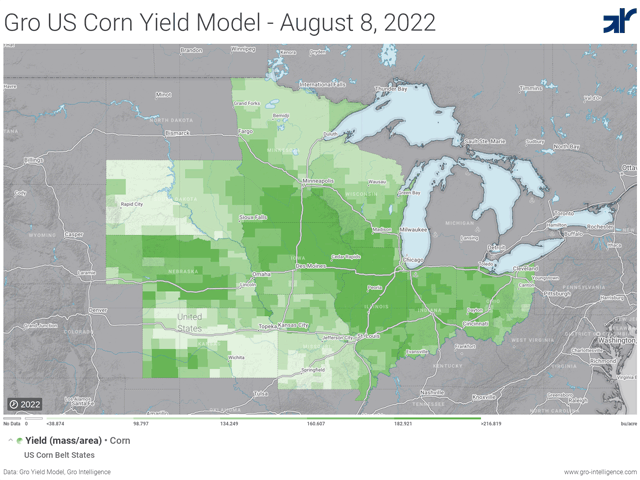
Gro's models agree. The most well-watered regions of the country -- a swath of southeastern Minnesota, northeastern Iowa and northern and central Illinois -- show the strongest yield potential. But parts of Ohio and Indiana look like a checkerboard, and a corridor along the Missouri River reflects a patchwork of precipitation and hotter temperatures. Irrigated regions in Nebraska and Kansas stand out.
The DTN Digital Yield tour publishes state yield estimates and detailed looks at growing conditions in Ohio, Indiana and Illinois on Tuesday; Iowa, Nebraska and Wisconsin on Wednesday; Kansas and Missouri on Thursday; and South Dakota and Minnesota on Friday.
Baranick said spring's cold, wet start created a tight planting window. While there's usually a disparity in plant maturities between the Dakotas and Missouri, for example, "it's almost like the entire crop has condensed its growing stages."
Gro Senior Analyst Jon Haines said the disparity in planting conditions shows up in the model through the NDVI maps, which is trailing among the lowest in recent years. But in other cases, it might be because that seed sat in the cold ground for weeks before germinating.
"The model provides a lot of granularity," Haines said, adding that this spring created a lot of haves and have-nots. "It reminds me of something I've always heard: Variation is never a good thing for national yields. If you have a lot of variability, it's usually not a good sign."
Crop estimates made in August are generally based on farmer anecdotes and surveys, and few private analysts are willing to cut their estimates that sharply right out of the gates, Osnato said, especially with August weather's ability to make or break a crop.
Gro employs an entirely different methodology. Its models are based on a wide array of public and private crop and environmental data including NDVI, land surface temperature maps, rainfall, USDA crop condition surveys, crop calendars, planted and harvested acreage data from NASS, cropland data, U.S. government soil surveys, weather forecasts, and much more. (For more on how Gro's yield models work, please read "Data Put to the Test" here: https://www.dtnpf.com/…)
This year, the data isn't favorable. Land surface temperatures have been near historical highs. The NDVI map is trending below normal, reflecting higher temperatures, planting delays or some other combination of factors.
Osnato said he expects USDA to trim its 177 bushel-per-acre yield estimate but thinks the agency will wait to make major changes until it starts incorporating field data in September.
DTN and Gro Intelligence partner up in the second week of August each year to evaluate crop conditions across the Corn Belt. But this year's planting delays mean the tour's estimates are based on a crop that's earlier along in its development, Haines said. That means soaking rains this weekend across northern Iowa, southern Minnesota and Wisconsin could provide a big boost, not just soybean yields, but corn yields, too.
"It's the data. Sometimes the numbers are slower" to reflect changes than a crop that just received a well-timed rain, he said.
While the models may take longer to reflect what farmers on the ground know, Hultman said Gro's yield models put the bigger picture into perspective. Rather than a few samples and lots of statistics, the models include data from every county across the Corn Belt.
"I just love the unique perspective this brings, and I'm looking forward to this year," Hultman said.
To learn more about the DTN Digital Yield Tour and Gro Intelligence, visit the tour's Spotlight page here: https://spotlights.dtnpf.com/… and Gro Intelligence here: https://gro-intelligence.com/….
Email your own observations as the tour progresses this week to katie.dehlinger@dtn.com and matt.wilde@dtn.com.
(c) Copyright 2022 DTN, LLC. All rights reserved.

