DTN Retail Fertilizer Trends
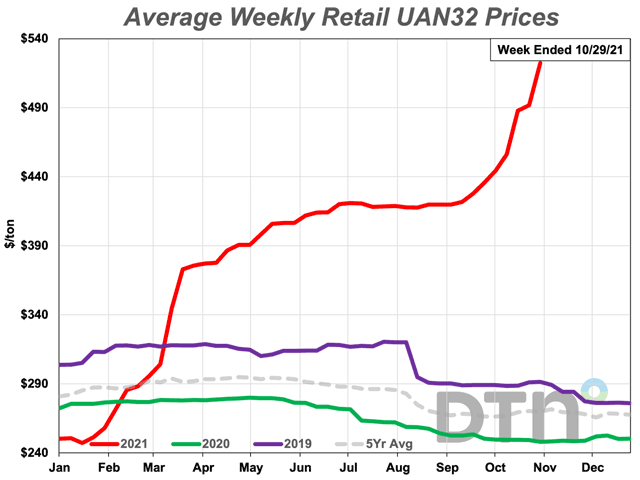
Nitrogen Fertilizer Prices Close in on All-Time Highs as UAN32 Breaks Record
MT JULIET, Tenn. (DTN) -- The retail fertilizer price spike continues, with seven of the eight major fertilizers tracked by DTN posting significant gains and one setting a new record. UAN32 cost an average of $522 per ton in the fourth week of October, the highest in DTN's 13 years of gathering bids.
While the nitrogen fertilizer increased 18% in price from the previous month, it wasn't the largest price jump seen in the data this week. That honor goes to anhydrous, which climbed 26% from last month to $982/ton. It's nearing prices last seen in November 2008.
Urea, at $751/ton, increased 21% in price from last month. Like other nitrogen fertilizers facing supply crunches this year, it's closing in on its historical highs. According to DTN data, urea's highest retail price was $770/ton in the week of May 21, 2012.
The average retail price of UAN28 increased 18% from last month to $458/ton. The only higher price in DTN's database is $482/ton the week of Nov. 3, 2008.
P[L1] D[0x0] M[300x250] OOP[F] ADUNIT[] T[]
The average retail price of potash increased 13% from the previous month to $731/ton, the highest since July 2009.
Phosphate prices also increased, with DAP up 12% at $812/ton and MAP up 9% at 873/ton.
The only fertilizer that didn't post a significant price increase, which DTN considers a change of 5% or more, was 10-34-0. Its price was 4% higher than last month at $663/ton.
All nitrogen fertilizers are now more than double in price what they were a year ago, with anhydrous up 131%, UAN28 119%, and urea and UAN32 110%. Potash is 120% higher, MAP is now 83% more expensive, DAP costs 81% more and 10-34-0 is up 46%.
DTN gathers fertilizer price bids from around 300 retailers to compile the DTN Fertilizer Index each week. In addition to national averages, MyDTN subscribers can access the full DTN Fertilizer Index, which includes state averages, here: https://www.mydtn.com/….
Last week, this column looked at how tight fertilizer supplies would influence South America's corn and soybean plantings. You can read more on that here: https://www.dtnpf.com/….
| DRY | ||||
| Date Range | DAP | MAP | POTASH | UREA |
| Oct 26-30 2020 | 448 | 477 | 332 | 358 |
| Nov 23-27 2020 | 456 | 495 | 337 | 359 |
| Dec 21-25 2020 | 474 | 535 | 365 | 363 |
| Jan 18-22 2021 | 493 | 563 | 379 | 387 |
| Feb 15-19 2021 | 600 | 648 | 404 | 457 |
| Mar 15-19 2021 | 616 | 693 | 424 | 496 |
| Apr 12-16 2021 | 624 | 702 | 432 | 509 |
| May 10-14 2021 | 631 | 702 | 437 | 515 |
| Jun 7-11 2021 | 656 | 717 | 450 | 527 |
| Jul 5-9 2021 | 690 | 729 | 491 | 549 |
| Aug 2-6 2021 | 695 | 755 | 557 | 556 |
| Aug 30-Sep 3 2021 | 697 | 756 | 571 | 557 |
| Sep 27-Oct 1 2021 | 722 | 800 | 647 | 620 |
| Oct 25-29 2021 | 812 | 873 | 731 | 751 |
| Liquid | ||||
| Date Range | 10-34-0 | ANHYD | UAN28 | UAN32 |
| Oct 26-30 2020 | 456 | 423 | 209 | 249 |
| Nov 23-27 2020 | 457 | 424 | 210 | 249 |
| Dec 21-25 2020 | 463 | 461 | 210 | 250 |
| Jan 18-22 2021 | 481 | 482 | 215 | 251 |
| Feb 15-19 2021 | 522 | 530 | 245 | 288 |
| Mar 15-19 2021 | 596 | 671 | 331 | 373 |
| Apr 12-16 2021 | 609 | 700 | 345 | 387 |
| May 10-14 2021 | 620 | 713 | 361 | 406 |
| Jun 7-11 2021 | 620 | 718 | 363 | 414 |
| Jul 5-9 2021 | 624 | 732 | 371 | 421 |
| Aug 2-6 2021 | 631 | 738 | 367 | 418 |
| Aug 30-Sep 3 2021 | 632 | 749 | 371 | 420 |
| Sep 27-Oct 1 2021 | 638 | 782 | 388 | 444 |
| Oct 25-29 2021 | 663 | 982 | 458 | 522 |
Katie Dehlinger can be reached at katie.dehlinger@dtn.com
Follow her on Twitter at @KatieD_DTN
(c) Copyright 2021 DTN, LLC. All rights reserved.


