2021 DTN Digital Yield Tour -- National
US Average Corn Yield at 176.5 BPA, Soybeans at 51.5 BPA, Tour Finds
ROCKVILLE, Md. and MT. JULIET, Tenn. (DTN) -- The U.S. should expect to see an overall average corn yield of 176.5 bushels per acre (bpa) and soybean yield of 51.5 bpa, according to the final day of the 2021 DTN Digital Yield Tour.
Those numbers would be at or near record levels for the U.S., which set a corn yield record of 176.6 bpa in 2017 and a soybean record of 52 bpa in 2016. They are also slightly higher than USDA's most recent August estimates, which trimmed the U.S. corn yield to 174.6 bpa and soybeans to 50 bpa.
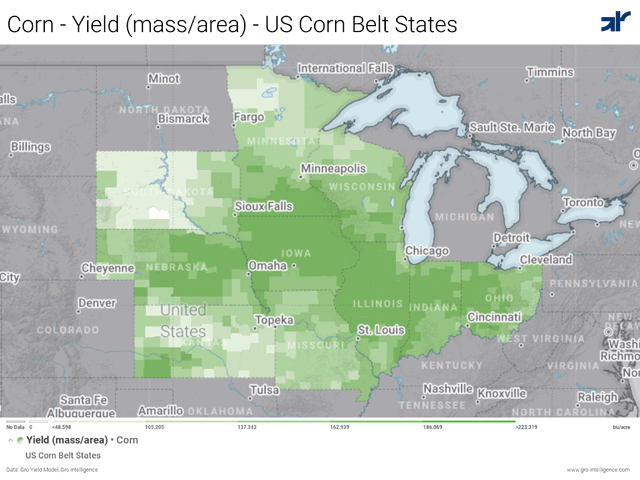
For the past week, DTN has partnered with Gro Intelligence for its digital crop tour of the major corn- and soybean-producing states. Gro's real-time yield models, which update daily, use satellite imagery, rainfall data, temperature maps and other public data to create county and state-level yield estimates. This year, the corn model also included Gro's Drought Index, just in time for persistent dry conditions in the Northern U.S. to play a significant role in yield estimates this year.
See Gro's current yield estimates for 2021 here: https://app.gro-intelligence.com/….
Gro's yield models provided a more moderate view of the progress of the corn and soybean crops this summer than USDA's, noted Gro Senior Research Analyst Mintak Joo. Where conditions have been ideal for crop production, namely the Eastern Corn Belt, Gro forecasts solid crops where USDA is predicting bin-busting, record-shattering numbers. Where drought has hampered production, such as in the Dakotas, Minnesota and Wisconsin, USDA likewise is predicting lower and more dire yield situations than Gro.
For example, Gro sees a strong 203.5-bpa corn yield in Illinois, while USDA predicts 214 bpa, a number that would top the previous state yield record by 4 bpa. Where Gro predicts a North Dakota corn crop diminished to 120 bpa, on average, USDA sees the state plummeting to 106 bpa, the lowest in over a decade.
"Overall, USDA's estimates are more extreme, which is why, when you average it out, we're relatively close on the overall yield estimates," said Joo.
P[L1] D[0x0] M[300x250] OOP[F] ADUNIT[] T[]
That difference is mostly driven by how USDA and Gro are operating at this time of the year, with USDA relying mostly on farmer surveys and Gro watching algorithm-driven yield models adjusting to real-time weather and satellite data. "Basically, our models account for more chance of recovery for the corn and especially soybean crops in the latter part of the season than USDA is accounting for," Joo explained. "That's survey versus modeling at play."
Time will tell, but there is plenty of reason to believe Gro's numbers may be more accurate at this point in the season, said DTN Lead Analyst Todd Hultman.
"I consider the national yield estimates from this year's Digital Tour of 176.5 bpa for corn and 51.5 bpa for soybeans to be good, credible estimates for this time of year," Hultman explained. "For a risk manager, the tour estimates are probably even better benchmarks at this point than USDA's estimates because they have a little more bearish possibility built in for this fall."
August estimates are, in general, a thorny undertaking for all, Hultman cautioned.
"I want to emphasize how difficult it is to come up with decent corn and soybean crop estimates in the month of August, as it is still quite early in the growing season and weather remains a key variable," he said. "Even USDA, with all its resources and access to 18,600 producer surveys, has a 90% confidence interval of plus or minus 6.7% over the past 20 years for corn, the equivalent of give or take a billion bushels."
So much of the season still lies ahead, between continued grain fill, critical harvest conditions, and of course, market factors. "August remains a crucial month for crop development, and these estimates will change along the way but are a good snapshot for understanding this year's crop potential," Hultman concluded. "Unfortunately, they don't tell us anything about China's demand in the season ahead -- another big factor for upcoming corn and soybean prices that DTN will also monitor closely."
Weather was the major story of the year, added DTN Ag Meteorologist John Baranick. "There has been drought in the northwestern Corn Belt all season long, stretching back to last year," he noted. "And in the southeast, there either was none, or it was alleviated rather nicely by rains early in the season. And then there is the transition zone between the two that has seen much lower rainfall overall and going in and out of drought throughout the season as storms hit and missed."
As these moisture conditions wax and wane, so do Gro's yield models, which typically stabilize around a final yield estimate for each state and county in November.
See the state-by-state yield estimates from Gro, alongside USDA's estimates and last year's crop here:
| CORN YIELDS | |||
| USDA | USDA | ||
| STATE | GRO INTEL | AUGUST | 2020 |
| ILLINOIS | 203.5 | 214 | 192 |
| INDIANA | 190.2 | 194 | 187 |
| IOWA | 199.0 | 193 | 178 |
| KANSAS | 147.3 | 138 | 134 |
| MINNESOTA | 180.8 | 166 | 192 |
| MISSOURI | 170.6 | 171 | 171 |
| NEBRASKA | 187.6 | 186 | 181 |
| OHIO | 186.6 | 193 | 171 |
| SOUTH DAKOTA | 142.7 | 133 | 162 |
| WISCONSIN | 178.5 | 167 | 166 |
| *NORTH DAKOTA | 120.0 | 106 | 139 |
*North Dakota state yield model is unofficial.
| SOYBEAN YIELDS | |||
| USDA | USDA | ||
| STATE | GRO INTEL | AUGUST | 2020 |
| ILLINOIS | 60.8 | 64 | 59 |
| INDIANA | 58.0 | 60 | 58 |
| IOWA | 57.4 | 58 | 53 |
| KANSAS | 42.6 | 41 | 40.5 |
| MINNESOTA | 48.1 | 43 | 49 |
| MISSOURI | 49.7 | 50 | 50 |
| NEBRASKA | 60.3 | 60 | 57 |
| OHIO | 57.4 | 58 | 54 |
| SOUTH DAKOTA | 44.6 | 39 | 45.5 |
| WISCONSIN | 50.5 | 49 | 51 |
| NORTH DAKOTA | 33.9 | 24 | 33.5 |
You can follow the tour's past progress, as it moved west to east across the Corn and Soybean Belts here:
-- Day One: Nebraska and the Dakotas: https://www.dtnpf.com/…
-- Day Two: Kansas and Missouri: https://www.dtnpf.com/…
-- Day Three: Iowa, Minnesota and Wisconsin: https://www.dtnpf.com/…
-- Day Four: Illinois, Indiana and Ohio: https://www.dtnpf.com/…
For more information on the 2021 DTN Digital Yield Tour and past ones, visit here: https://spotlights.dtnpf.com/…. Learn more about Gro Intelligence here: https://gro-intelligence.com/….
Emily Unglesbee can be reached at Emily.unglesbee@dtn.com and Katie Dehlinger can be reached at katie.dehlinger@dtn.com.
(c) Copyright 2021 DTN, LLC. All rights reserved.


