

2021 DTN Digital Yield Tour - Day 4
Indiana, Ohio on Track for Record Yields, With Illinois Close Behind, Tour Finds
ROCKVILLE, Md. (DTN) -- The Eastern Corn Belt is approaching a record-setting year for corn and soybean yields, according to Day Four of the 2021 DTN Digital Yield Tour, which explored Illinois, Indiana and Ohio.
Powered by Gro Intelligence, the tour is an in-depth look at how this year's corn and soybean crops are progressing using Gro's real-time yield maps, which are generated with satellite imagery, rainfall data, temperature maps and other public data. Unlike static estimates, Gro's yield projections update daily on a county and state level, so the numbers at publication time may be slightly different than what you find on the Gro website.
Gro's yield models expect Illinois to hit a statewide average corn yield of 203.5 bushels per acre (bpa), up 11.5 bpa from last year, with a projected average soybean yield of 60.9 bpa, chasing the state record of 63.5 bpa set in 2018.
Things look even better in Indiana, where the models suggest the state will set a corn yield record with a projected average of 190.2 bpa, up 3 bpa from last year. Indiana's estimated soybean yield of 58 bpa would also match its 2020 record. Finally, Ohio is also on track to hit or surpass its 2018 yield records for both corn and soybeans, with projected statewide averages of 186.6 bpa and 57.4 bpa, respectively.
To see Gro's yield models and explore the county-level detail for each state, navigate here:
-- Illinois: https://app.gro-intelligence.com/…
-- Indiana: https://app.gro-intelligence.com/…
-- Ohio: https://app.gro-intelligence.com/…
"What can you say other than it's been nearly perfect weather for the Eastern Corn Belt?" said DTN Ag Meteorologist John Baranick.
"For all three states, there was some delay in the early planting. It was a little cold and a little wet, and there were some frosts in the middle of May that may have necessitated some replanting, but when the calendar turned to June, temperatures warmed up nicely," he explained. The region saw seasonable heat and timely rains, for the most part, with the exception of northern Illinois, which has stayed drier. Illinois saw some flooding, and things dried out in parts of Indiana and Ohio in late July, but recent rainfalls have likely alleviated that, Baranick added.
"There were some misses with the rainfall, and that has led to some areas getting a bit abnormally dry, but rains this week have and will continue to be beneficial to help corn and soybeans fill out the rest of the season," he concluded.
ILLINOIS
-- Corn: 203.5 bpa, up 11.5 bpa from last year.
-- Soybeans: 60.6 bpa, almost 2 bpa higher than last year.
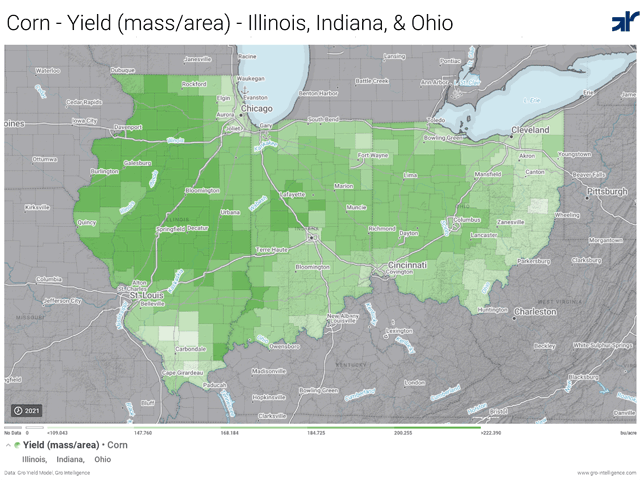
Illinois corn boasts uniformly strong yields across most of the state, with most counties reaching averages of 180 to 220 bpa.
"If you had to pick a blemish on the three states, it would be in far northern Illinois," Baranick said. "The top two to three tiers of counties have been in some category of drought since late April. However, rains have not been as infrequent as the northwestern Corn Belt and have also been timely, especially over the last week where we have seen a good 1 to 4 inches of rainfall in those areas."
P[L1] D[0x0] M[300x250] OOP[F] ADUNIT[] T[]
The lowest county corn yield estimate is in Dupage County, at 150.7 bpa, but that county is home to a number of Chicago's populous suburbs. The next lowest yield, 153.4 bpa, is in Hardin County, bordering Kentucky, at the opposite end of the state. The highest corn yield average, 219.4 bpa, was spotted in Menard County to the northwest of Springfield.
Matt Bennett, who farms in Shelby and Moultrie counties to the southeast of Decatur, said he thinks Gro's statewide estimate of 203.5 bpa is a definite possibility, and the state might also have a shot at reaching its 2018 record of 210 bpa.
"Especially after the rains we've had here in the last several days, it seems to me that most crops are going to finish really well," Bennett said. "If you asked me what the chances are that we'll break the (corn) record, I'd say it's 50-50."
For soybeans, Bennett said Gro's 60.8-bpa estimate is in the ballpark, and it's a little too soon to tell if beans will push the state record of 63.5 bpa, also set in 2018. "With really good weather, it's a possibility," he said.
In his area, a lot of farmers planted soybeans early and weathered a cold snap, but with the regular rains they've had the past few weeks, he thinks reports of yields in the 80s or higher will be widespread. Gro estimates Shelby County soybeans will average 64.2 bpa while Moultrie will average 66.5 bpa.
Bennett's farms are just south of Illinois's highest yielding county, Piatt County, forecast to average 68.14 bpa. Dupage County once again brings up the low end with 46.8 bpa. Perry County, in southern Illinois, is the second-lowest yielding at 49 bpa.
See video of Bennett exploring his fields and yield potential for the digital yield tour here: https://www.dtnpf.com/….
INDIANA
-- Corn: 190.2 bpa, up 3 bpa from last year.
-- Soybeans: 58 bpa, on par with last year.
Indiana's weather has left it in good shape to finish grainfill stages for both corn and soybeans, Baranick said. "Indiana is sitting roughly around 100% of normal moisture, and that extends into western Ohio as well," he said. Northern Indiana did see some wind damage from a storm system that moved through the state Aug. 10-11, but otherwise, the state pushing record yields is unsurprising, Baranick said.
That's clear in the normalized difference vegetation index (NDVI) map for Indiana, which has shown conditions ranging from white (average) to dark green (lusher than normal) since early July. See it here: https://app.gro-intelligence.com/….
Scott Wallis, who farms in far southwest Indiana and southeast Illinois, concurred that the state's moisture has been nearly perfect. Wallis Farms was blessed with 4 inches of rain in June, almost 6 inches of rain in July and more than 2.5 inches so far in August. "We've been extremely fortunate," Wallis said. "It's probably one of the best-looking areas in the Midwest."
In Gro's corn yield models, the state's highest-yielding counties stretch down the western edge and across the upper half of the state. There, yields range from the upper 180s all the way up to 200 bpa, with west-central Montgomery County logging a state high of 203 bpa. Elsewhere in the state, average county yields mostly sit in the 160s and 170s, bottoming out at 158.7 bpa in southeastern Dearborn County.
For soybeans, the state's highest-yielding counties stretch in a band across central Indiana, from the Illinois border to the Ohio border, north of Indianapolis. There, yields range from the upper 50s, into the mid-60s, with central Tipton County hitting 66 bpa. Outside this region, county averages are reliably in the mid-50s, dipping down as low as 48 bpa in Floyd County, in southeast Indiana.
Wallis predicts his corn yields will exceed the past farm record by 5 to 10 bpa, and soybeans will beat the farm's previous all-time high by 2 to 5 bpa. "We feel today we will have a record crop," he said. See video of Wallis assessing his crop fields and yield potential for the tour here: https://www.dtnpf.com/….
OHIO
-- Corn: 186.6 bpa, up 15.6 bpa from last year.
-- Soybeans: 57.4 bpa, up 3.4 bpa from last year.
Not all of Ohio has seen ideal weather conditions, Baranick noted. Western Ohio is sitting at normal moisture levels, but "eastern Ohio, which is hill country and less farmed, is another dry spot where rainfall is more like 60% to 80% of normal," he said.
In central Pickaway County, Keith Peters is caught in this drier trend and hoping forecast moisture this weekend will preserve his potential yields, after receiving only 1 inch to 1.5 inches of rain in the past month.
"These storms are just going around me. We're not getting the rains at all," Peters lamented. "Yields are in question."
But where crop acreage is heavier, such as northwest Ohio, rains have been more generous, and the NDVI map shows well-watered conditions. The Gro corn yield map is similarly positioned, with the best yields stretching across the western half of the state, from north of Cincinnati up to Fort Wayne. There, county averages range from the upper 180s into the 190s. Van Wert County, on the northwest border of the state, logs the highest current average, 197 bpa. In the eastern half of the state, average yields drop into the 150s and 160s, with the far eastern county of Harrison dropping to 144 bpa.
Where he's located south of Columbus, Peters said his best corn ground as of now could range between 180 to 190 bpa. On course-textured soil where corn plants are fired up above the ear, 160 to 170 bpa is possible. But those numbers are dependent on future rainfall.
Gro's soybean model shows the strongest yields stretch farther across the state, moving as far east as Zanesville, in addition to blanketing the western half of the state. These counties boast average yields in the upper 50s, with Van Wert again taking top yield honors at 61.5 bpa. County yields in the low to mid-50s are common elsewhere in the state, with the urban northeastern county of Cuyahoga dropping as low as 41.4 bpa.
Soybeans have more time to gain yield, and Peters said his best soils still have "phenomenal" yield potential, but on his coarser-textured fields, the lack of rain is already taking a toll. Overall, Peters suspects Gro's statewide yield estimates are spot-on for the state, but -- as sometimes happens in farming -- those averages aren't in the cards for him.
"I know farmers a little south and west of me, and they have some of the best crops they've ever had," Peters said. "It's hard to hear how great the crop (statewide) is going to be."
On Friday, Aug. 13, the DTN Digital Yield Tour will wrap up with a final look at Gro's overall national yield predictions for the 2021 corn and soybean crops.
Catch up on the tour's progress this week here:
-- Day One: Nebraska and the Dakotas: https://www.dtnpf.com/…
-- Day Two: Kansas and Missouri: https://www.dtnpf.com/…
-- Day Three: Iowa, Minnesota and Wisconsin: https://www.dtnpf.com/…
To learn more about the DTN Digital Yield Tour and Gro Intelligence, visit the tour's Spotlight page here: https://spotlights.dtnpf.com/… and Gro Intelligence here: https://gro-intelligence.com/….
Email your own observations as the tour progresses this week to katie.dehlinger@dtn.com, Emily.unglesbee@dtn.com and matt.wilde@dtn.com.
(c) Copyright 2021 DTN, LLC. All rights reserved.

