
Kub's Den
If Farmers Sold Grain Like Contractors Bid Projects
In recent years, when the prices of various construction materials -- lumber, paint, caulk, fittings -- have been either rapidly rising or viciously volatile, many building contractors have started using "Cost-Plus" contracts to bid for projects. Rather than submitting a written bid that says, "I can build you that deck for $35,000, total," the contractor might instead write a bid that says, "I can build you that deck, and it will cost $15,000 for my services, plus whatever it costs to buy the raw materials." The total might end up anywhere from $25,000 to $55,000.
Imagine if farmers could do something like that. "Dear Local Co-op Manager: I can deliver 100,000 bushels of corn to you by November, and it will cost you $100,000 for my services, PLUS whatever it costs to purchase all the inputs, like seed, fertilizer, diesel, and land."
The major difference, of course, is that custom-built decks aren't standardized, interchangeable, globalized commodities, but bushels of grain are. Producers of an abundant commodity don't get to dictate the global price of their products; they instead must compete against every other low-cost producer of that commodity to try to find a buyer willing to receive the commodity at whatever the prevailing, globally-agreed-upon price happens to be.
Nevertheless, this is a time of year when farmers are getting ready to plant and, therefore, when they are considering which planting projects will be the most profitable. Every land-grant university in the heart of the U.S. Corn Belt has helpfully put together tables and spreadsheets to help the farmers of their regions add up what it will cost to produce a crop of grain in 2024, and whether or not they can expect to have any profit left over once the project is complete.
At Iowa State University, for instance, Extension economist Alejandro Plastina's office gathers average statewide cash rental rates each year, plus information about local seed costs, nitrogen costs, and every other input required to grow a crop of grain -- from labor to machinery -- then assembles that information at the Ag Decision Maker website so that individual farmers can adjust the assumptions to accurately reflect individual circumstances. A range of scenarios are presented, but in the middle-of-the-road assumptions, a farmer in Iowa in 2024 can grow conventional corn in a corn-and-soybeans rotation and achieve a 202 bushel-per-acre yield, paying the equivalent of $285 per acre in cash rent, plus various other costs, for a total of $901.86 in costs per acre. That works out to $4.46 per bushel.
If the farmer can market that corn for more than $4.46 per bushel, then the farmer will be able to make a profit this year.
As it happens, it's not presently possible to sell 2024 corn for more than $4.46 per bushel in most of Iowa, when the December futures contract is around $4.70 per bushel and local basis for new-crop corn would shave about 40 cents off of that price tag, bringing it to $4.30 per bushel.
Meanwhile, Iowa State's middle-of-the-road assumptions for growing conventional soybeans imply a cost of production at $11.24 per bushel (at 59 bpa, with the same $285 cash rent equivalent for the land). New-crop cash bids around $11.30 per bushel in the Iowa countryside suggest that soybeans may, in fact, pencil out more profitably than corn in the current market conditions.
And that is why the broad, average assumptions gathered and published by all these land-grant universities are so interesting to market analysts and traders. Without getting bogged down in any one individual farm or any one individual farmer's contracted values for herbicide or seed, we can nevertheless predict the relative fortunes of the farm industry in the coming year. Will grain producers be likely to have lots of disposable income in 2024? (Answer: No.) Which crops will be relatively more desirable to plant? Which crops may receive a relatively larger share of the acreage mix? Does this analysis change depending on which part of the country one is considering?
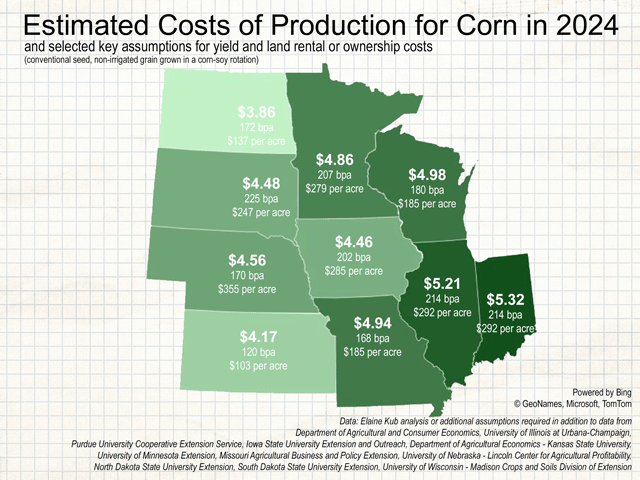
With a big caution that each university's methods for adding up these costs of production were quite different from each other, and that these numbers shouldn't necessarily be considered an apples-to-apples comparison from one state to the next, here are some of the middle-of-the-road cost-of-production estimates for 2024 and the key assumptions that went into those calculations.
P[L1] D[0x0] M[300x250] OOP[F] ADUNIT[] T[]
| State | Corn C.O.P. | Soybeans C.O.P. | Yield assumptions (corn, soybeans) | Land charge per acre |
| Illinois | $5.21 | $11.97 | 214 bpa, 67 bpa | $292 |
| Indiana | $5.32 | $12.41 | 190 bpa, 58 bpa | $253 |
| Iowa | $4.46 | $11.24 | 202 bpa, 59 bpa | $285 |
| Kansas | $4.17 | $8.91 | 120 bpa, 45 bpa | $103 |
| Minnesota | $4.86 | $11.96 | 207 bpa, 57 bpa | $279 |
| Missouri | $4.94 | $10.57 | 168 bpa, 55 bpa | $185 |
| Nebraska | $4.56 | $10.25 | 170 bpa, 50 bpa | $355 |
| North Dakota | $3.86 | $9.05 | 172 bpa, 41 bpa | $137 |
| South Dakota | $4.48 | $12.41 | 225 bpa, 55 bpa | $247 |
| Wisconsin | $4.98 | $11.38 | 180 bpa, 52 bpa | $185 |
Compare those projected costs of production to new-crop prices ($4.70 December 2024 corn futures and $11.80 November 2024 soybean futures), and you can see that in most areas of the Corn Belt, growing grain is likely to be either a somewhat unprofitable venture or a wildly unprofitable venture. Remember that basis values tend to be quite wide out west, so even for the states that appear to have relatively low costs of production, their ultimate profitability compared to the benchmark futures price may be even harder to achieve.
The places with the highest yield assumptions don't necessarily get to walk away with the highest profits. This is usually because these are also the places with the most punishingly high land costs. But again, it is dangerous to make any real comparisons between each state's numbers, because they are each calculated using different methods. Each state gathered data at different times (some states are using fertilizer prices from last fall; some are using prices from this spring). Some states include notably high property taxes (Nebraska), and others don't. Also, using any number as a statewide average can be misleading when in South Dakota, for instance, it is possible to grow either 100 bpa corn or 300 bpa corn, depending on which part of the state is being considered.
This is probably not how these Extension educators want their carefully researched data to be used, like it's some kind of competition against their neighbors, or some final word about farmer profitability in 2024. It's probably not how most farmers would want the data to be shared, either. Presumably, farmers in North Dakota or Kansas don't want competitors from the East to see these land charge numbers be encouraged to come and outbid them for land in these challenging regions. There is usually a reason why land prices have evolved to be either higher or lower than average.
All of which merely emphasizes the importance of calculating these costs of production on an individual basis. Farmers who choose to use these university Extension tables and spreadsheets shouldn't feel obligated to only use the resources from their own states -- they may find they prefer either the simplicity or the thoroughness of some other university's approach.
But from a whole-market perspective, it may be safe to say that U.S. corn farmers could lose anywhere from zero to $1 per bushel growing grain this year, that soybeans might pencil out with relatively more profit than corn in certain regions, and that land prices are the biggest make-or-break influence on any crop budget. For a real bid sheet on what it would cost to build that construction project or deliver that crop of grain, all we can confidently say is that costs will vary.
**
Sources and more disclaimers:
Illinois: https://farmdocdaily.illinois.edu/…
Indiana: https://ag.purdue.edu/… (breakeven costs not directly published; required author assumptions for variable costs + overhead costs)
Iowa: https://www.extension.iastate.edu/…
Kansas: https://www.agmanager.info/…
Minnesota: https://extension.umn.edu/…
Missouri: https://extension.missouri.edu/…
Nebraska: https://cap.unl.edu/… (table above uses non-irrigated scenarios)
North Dakota: https://www.ndsu.edu/… (table above uses values from the "South Valley" region)
South Dakota: https://extension.sdstate.edu/… (breakeven costs not directly published; land charge not given, required author assumptions for central east South Dakota cash rent average from SDSU Extension)
Wisconsin: https://cropsandsoils.extension.wisc.edu/…
**
The comments above are for educational purposes only and are not meant as specific trade recommendations. The buying and selling of grain or grain futures or options involve substantial risk and are not suitable for everyone.
Elaine Kub, CFA is the author of "Mastering the Grain Markets: How Profits Are Really Made" and can be reached at analysis@elainekub.com or on X, formerly known as Twitter, @elainekub.
(c) Copyright 2024 DTN, LLC. All rights reserved.