Where Did All the Soybeans Go?
Biggest Surprise in USDA Acreage Report Was Planted Soybean Acres Number
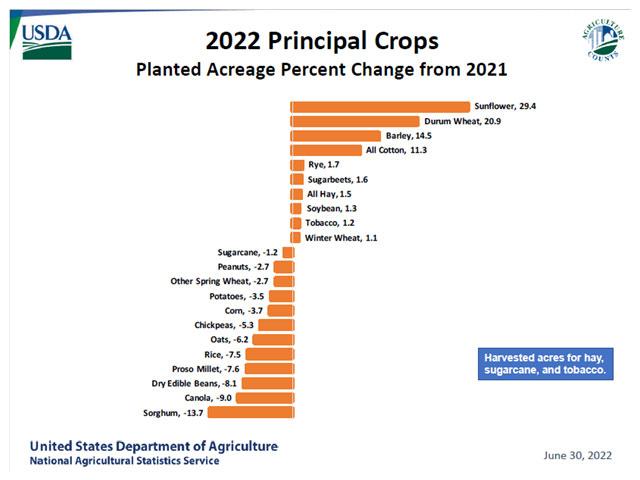
The prize for biggest surprise in the Thursday, June 30, USDA reports was clearly the planted soybean acres number. The 88.325 million acres in the Acreage report was 2.63 million smaller than the March intentions and comfortably below the trade average guess.
Some slippage had been anticipated, with the soy-to-corn ratio dropping to 2-to-1 back in early May. That was the hidden hand of the market encouraging producers to stick with corn planting plans despite soggy conditions. Anything under 2.3-to-1 typically draws acreage away from soybeans toward corn. The later it happens, the less impact, as important decisions about fertilizer and chemicals must be made. Late switches tend to be forced by Mother Nature and confined to acreage that can still "go either way."
The biggest soybean switches from March to June intentions were in the states everyone expected. North Dakota is down 1.1 million acres of beans versus March intentions. Minnesota is down 500,000 acres from March, with 17 states showing negative changes. Only five states added bean acres compared to March plans. The one big one was Illinois at 200,000 acres.
P[L1] D[0x0] M[300x250] OOP[F] ADUNIT[] T[]
Did you hear about the 4.03 million corn acres and 15.8 million for beans that were not planted as of the June survey? Those were included in the header of the Acreage report. USDA was basically letting everyone know how much of the presumed planted acreage was not, in fact, actually planted when the survey was closed on June 16. They indicated that acreage numbers will be re-surveyed in July for Minnesota, North Dakota and South Dakota due to the uncertainties about whether this ground eventually got planted, or if the acreage intentions changed. Anecdotally, seed dealers report beans still leaving the warehouse, but it will take a little fine-tuning to know if those are for late-planted fields (in the north) or double crop after wheat (farther south). We know that winter wheat harvest is a little ahead of the average pace, facilitating double-crop beans.
Speaking of double-crop soybeans, it sure seems like there should be more of them. If so, the final planted acreage figure will grow, as double crop is counted twice.
Why do we think there should be more?
First of all, we have the highest soybean prices since 2012 and an all-time high for the spring average price used by crop revenue insurance. The Biden administration also announced a while back that they were extending crop insurance eligibility for double-crop soybeans in 600-plus counties that had not previously been eligible. That means producers aren't sticking their neck out as far financially to take a shot at getting two incomes off the same ground this year. Obviously, there are some limiting factors like seed availability, fuel costs and adequate soil moisture, but the price incentives appear to be there.
A look at USDA's table on double crop is a little misleading. You see 5% double-crop acres in 2018, 2020 and 2021. That 5% number doesn't look too far out of line. However, going back to the previous high price period would show that 10% of the bean acres were double crop in 2013 and 7% in 2012. Even with a conservative 35 bushel-per-acre (bpa) yield, you are passing up close to $500 per acre in additional revenue, with no extra land rent.
Who seems to be a little light on the double-crop beans? Georgia, Maryland and North Carolina are far below their 2021 levels, although North Carolina's intentions of 23% are in line with 2019 and 2020. Alabama also looks light, although we're not talking a lot of acres there.
We suspect that final soybean acres will creep higher than shown in Thursday's report, and corn may even end up a little bigger. Soybeans, in particular, need the extra acres for the balance sheet, as ending stocks would get down to pipeline levels at this acreage and just a 2-3 bpa below trendline yield.
Alan Brugler can be reached at alan.brugler@bruglermarketing.com
(c) Copyright 2022 DTN, LLC. All rights reserved.


