

Harvest Prices for 2025 Crop Insurance
Revenue Protection Crop Insurance Sticks With Spring Guarantees: $4.70 for Corn, $10.54 for Soybeans
OMAHA (DTN) -- The harvest price for crop insurance fails to offer higher safety net protection than the spring price, with the average for December corn futures closing the month at $4.22 a bushel and November soybeans at $10.36 a bushel despite a price rally this week.
The farmer price protection will use the spring crop insurance guaranteed prices set at the end of February of $4.70 a bushel for corn and $10.54 for soybeans.
The harvest prices are set based on a running average throughout October of the closing price for the November soybean contract and the December corn contract.
Revenue protection policies use the higher of the projected price or the harvest price to calculate revenue guarantees unless the farmer opted to exclude the harvest price as a way to lower premiums. Revenue guarantees are determined by multiplying the higher of the projected or harvest price by the farm's actual production history (APH) yield and the chosen coverage level, which typically ranges from 75% to 85% across the Corn Belt.
Based on Risk Management Agency data, the crop insurance price guarantees apply to roughly 90 million acres of corn and 75 million acres of soybeans. Both totals are lower than USDA's planted acres because some farmers choose to self-insure their crops.
P[L1] D[0x0] M[300x250] OOP[F] ADUNIT[] T[]
DTN Lead Analyst Rhett Montgomery said the final crop guarantees reflect the relatively low volatility compared to recent years. In 2023, for example, corn prices fell more than a dollar from the February average to the October average, while soybeans dropped 92 cents. Last year was a decline of 50 cents for corn and $1.55 for soybeans. This year, it was 48 cents for corn and 18 cents on soybeans thanks largely to the significant rally in soybean prices through the second half of October.
"Using a typical 80% revenue protection coverage level, the deterioration of prices through the growing season is unlikely to trigger an insurance payout unless there is a reported yield loss," Montgomery said. "This is, of course, a result of the protected prices from February setting a fairly low floor when coverage level was accounted for."
USDA commodity costs and returns were not updated in October and may not be in November as a result of the government shutdown, but most recent per-bushel costs based on September data implied an average breakeven on corn of $4.81 per bushel and a breakeven on soybeans of $11.95 per bushel, which paints a challenging picture for profitability on 2025 crops, Montgomery said.
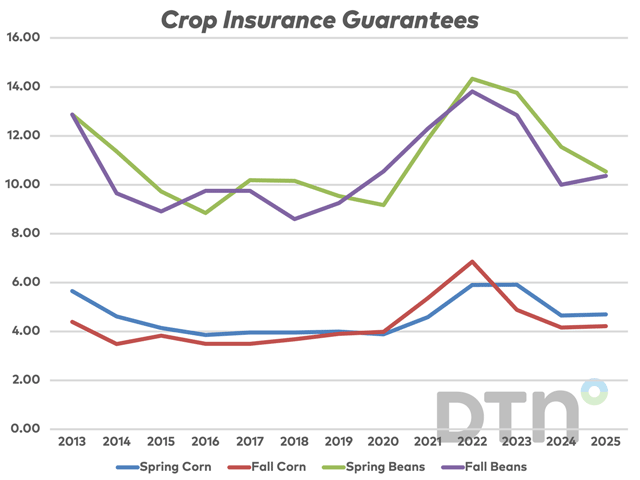
HISTORICAL LOOK AT PRICE GUARANTEES
This year marks the third straight year corn prices at harvest have come in below the spring guarantee. The 2020, 2021 and 2022 harvest prices for corn each beat out the spring guarantee. In 2021, the harvest price for corn reached $6.86 a bushel, which was the highest level since 2012.
Soybean harvest prices have not beat out the spring price since 2021 when the November futures ended at $12.30 a bushel. The harvest price triggered for soybeans in 2020 as well.
Prior to 2020, the harvest price had not triggered for corn since 2012 or soybeans since 2016, according to an analysis by the American Farm Bureau Federation.
Drought in 2012 led to the highest fall harvest price guarantees on record with $7.50 a bushel for corn and $15.39 a bushel for soybeans.
Below are the final averages of December corn and November soybean futures closes in October.
| October 2025 | Dec | Nov |
| dates | Corn | Soybeans |
| 10/1 | 4.1650 | 10.1300 |
| 10/2 | 4.2175 | 10.2375 |
| 10/3 | 4.1900 | 10.1800 |
| 10/6 | 4.2175 | 10.1775 |
| 10/7 | 4.1975 | 10.2200 |
| 10/8 | 4.2200 | 10.2950 |
| 10/9 | 4.1825 | 10.2225 |
| 10/10 | 4.1300 | 10.0675 |
| 10/13 | 4.1075 | 10.0775 |
| 10/14 | 4.1300 | 10.0650 |
| 10/15 | 4.1675 | 10.0650 |
| 10/16 | 4.2175 | 10.1075 |
| 10/17 | 4.2250 | 10.1950 |
| 10/20 | 4.2325 | 10.3175 |
| 10/21 | 4.1975 | 10.3075 |
| 10/22 | 4.2300 | 10.3475 |
| 10/23 | 4.2800 | 10.4475 |
| 10/24 | 4.2325 | 10.4175 |
| 10/27 | 4.2875 | 10.6725 |
| 10/28 | 4.3200 | 10.7825 |
| 10/29 | 4.3400 | 10.8025 |
| 10/30 | 4.3025 | 10.9125 |
| 10/31 | 4.3150 | 10.9975 |
| October 2025 Average | $4.22 | $10.36 |
| Spring 2025 Average | $4.70 | $10.54 |
| October 2024 Average | $4.16 | $10.00 |
Chris Clayton can be reached at Chris.Clayton@dtn.com
Follow him on social platform X @ChrisClaytonDTN
(c) Copyright 2025 DTN, LLC. All rights reserved.