

Technically Speaking
Grain Update Ahead of WASDE

Writing this blog in front of the September WASDE can definitely be a humbling exercise, but some of the technical factors in the corn market can be objectively judged, regardless of USDA influence. December corn has maintained uptrends on all time scales dating back to the mid-July lows at $5.61. Since then, December corn has unfurled a trendy, impulsive rally higher with all setbacks being buying opportunities. It is worth noting, however, that December corn has so far stalled out at the 61.8% retracement of the $7.66 to $5.61 selloff at 6.88. In addition, the most recent round of highs set last week were done on declining momentum from the last round of highs at $6.83 3/4. This sets up a very clear-cut bearish divergence in momentum from price should the December contract trade below the $6.54 corrective low and confirm it. That is essentially the level in this market that corn needs to trade below to effectively signal the end of this rally and a reason to move to a neutral or bearish policy moving forward. The well-defined directional triggers in this market are $6.88 and $6.54 with the post-WASDE trade likely violating one of those.
P[L1] D[0x0] M[300x250] OOP[F] ADUNIT[] T[]
The soybean market has been much more rangebound over the last month and a half with short-term trends currently pointed down. It is rather clear this market has been coiling inside the $13.56 to $14.89 range with a breakout likely in the immediate future. Given the seasonality of soybeans during September, obviously odds are geared for a lower move out of the potential breakout. From an hourly chart, we see some objective risk parameters from which to gauge directional exposure following the September WASDE. To the downside, we have the $13.73 corrective low from Friday and to the upside the $14.32 1/4 corrective low from Thursday. A breach of either of those levels should tip at least the short-term scales. From a longer-term perspective, we still feel the current consolidative pattern is part of a larger B-wave in a three-wave corrective sequence. If that count is correct, it would mean a breakout lower with trade resuming below the mid-July lows at 12.88 1/2 to complete the C-wave portion of this pattern.
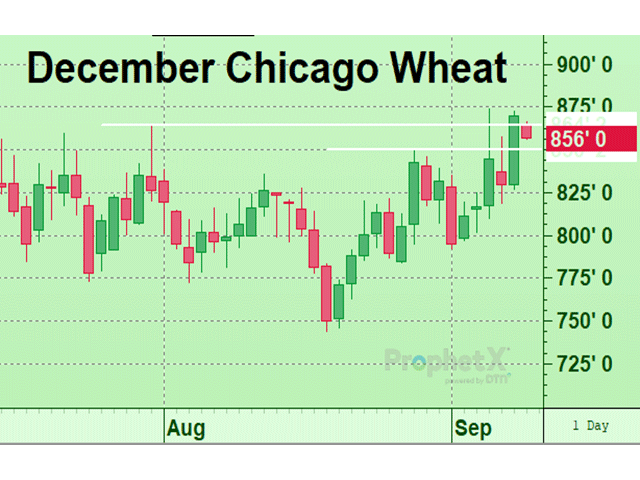
DECEMBER CHICAGO WHEAT:Wheat contracts have been tracing out a bottom for the last two to three months and it would appear are in the early stages of rallying away from that base. Momentum indicators like stochastics bottomed back on July 5, well before price did on Aug. 18, highlighting that the continued sell-off was being done on less and less velocity. Momentum has been trending solidly higher since, thrusting higher in the last two weeks as the December contract traded above resistance from July and August. The key for the Chicago wheat market will be to sustain strength in the sessions immediately ahead, using the former resistance outlined above as new support. This is a sign of a market on good footing as opposed to one which dips back into the previous range and is clearly not ready for a sustainable rally. The 50-day moving average at $8.17 should also act as new support on corrective setbacks. Simply put, the wheat market needs to behave like a market breaking out, holding previous resistance levels as support to encourage additional buying from the speculative crowd.
**
Comments above are for educational purposes only and are not meant as specific trade recommendations. The buying and selling of grain or grain futures or options involve substantial risk and are not suitable for everyone.
(c) Copyright 2022 DTN, LLC. All rights reserved.
Comments
To comment, please Log In or Join our Community .