

Technically Speaking
Monthly Analysis: Grain Markets

Corn (Cash): The DTN National Corn Index (NCI.X, national average cash price) closed at $3.28, down 6 3/4 cents for the month. The major (long-term) trend remains sideways between the low of $2.81 1/2 (October 2014) and $4.10, a price that marks the 23.6% retracement level of the previous downtrend from $8.26 1/4 (August 2012). The NCI.X continues to hold near the midpoint of this range at $3.39 1/2. Monthly stochastics remain bullish near the midrange level of 50%.
Corn (Futures): The December contract closed at $3.84 3/4, down 3 3/4 cents on the monthly chart. The major (long-term trend remains sideways between the October 2014 low of $3.18 1/4 and the July 2015 high of $4.54 1/4. The more active futures contract, in this case December, continues to hold near the midpoint of this range at $3.86 1/4. Monthly stochastics remain bullish, also near the midpoint of 50%, indicating the market could see renewed buying interest.
P[L1] D[0x0] M[300x250] OOP[F] ADUNIT[] T[]
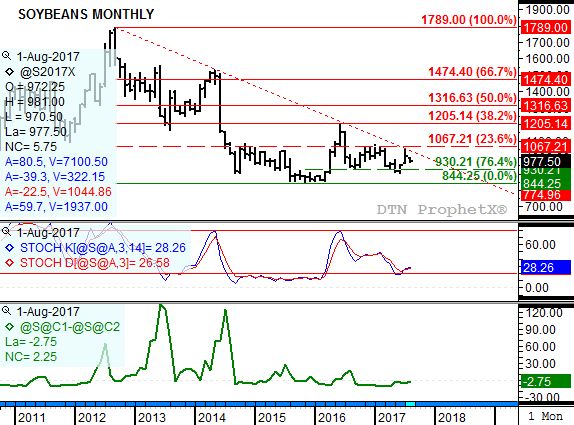
Soybeans (Cash): The DTN National Soybean Index (NSI.X, national average cash price) closed at $9.34 3/4, up 54 cents for the month. The NSI.X left a bullish gap on its monthly chart between the June high of $8.09 3/4 and July low of $9.03 1/4. While this indicates the major (long-term) uptrend should gain momentum, the NSI.X came up just short of posting a new 4-month high beyond $9.70. Its July high was $9.62 1/2 (July 11). This could lead to consolidation in August, with the NSI.X vulnerable to filling the previously mentioned price gap.
Soybeans (Futures): The more active November contract closed at $10.07 1/4, up 52 1/2 cents on the monthly chart. November futures left a bullish gap between the June high of $9.58 and July low of $9.63. However, the contract ran into trendline resistance at $10.57 1/2 leaving its monthly high of $10.47 below the 4-month high of $10.52 1/4. This could lead to a consolidation pattern between the July high and support of $9.30 1/4.
SRW Wheat (Cash): The DTN National SRW Wheat Index (SR.X, national average cash price) closed at $4.45, down 50 cents for the month. Cash SRW wheat remains in a major (long-term) uptrend. The July high of $5.27 1/2 was a test of major resistance at $5.24, a price that marks the 33% retracement level of the previous downtrend from $9.14 1/2 through the low ow $3.31 3/4. Support for this sell-off, what looks to be Wave 2 of a 5-wave uptrend, is at $4.29 1/2, then $3.96 1/4. Monthly stochastics remain bullish.
HRS Wheat (Futures): The September Chicago (SRW) contract closed at $4.74 1/2, down 51 1/2 cents for the month. Despite the lower monthly close the market's major (long-term) trend remains up. The July sell-off from a test of major resistance at $5.71 3/4 (a posted high of $5.74 1/2) led to a test of support at $4.48 3/4. The most recent move looks to be Wave 2 of a 5-wave uptrend, with monthly stochastics still bullish.
To track my thoughts on the markets throughout the day, follow me on Twitter: www.twitter.com\DarinNewsom
Comments
To comment, please Log In or Join our Community .