
Technically Speaking
Monthly Analysis: Grain Markets
Corn (Cash): The DTN National Corn Index (NCI.X, national average cash price) closed at $3.26 1/2, down 4 1/4 cents for the month. The major (long-term) trend of the NCI.X remains difficult to classify. The best description could be a long-term sideways trend between the low of $2.81 1/2 (October 2014) and $4.10, a price that marks the 23.6% retracement level of the previous downtrend from $8.26 1/4 (August 2012). Still, the new low (and close) of $2.73 from August 2016 remains a problem.
Corn (Futures): The May contract closed at $3.64 1/4, down 9 1/2 cents on the monthly chart. Similar to the NCI.X (see above), the major (long-term) trend of corn futures could best be classified as sideways with support at the low of $3.18 1/4 (October 2015) and resistance at $4.43 1/2. The latter price marks the 23.6% retracement level of the previous major downtrend from the high of $8.49 ((August 2012). Also as with the NCI.X, corn futures posted a new low of $3.14 3/4 during August 2016, usually a sign of a bearish breakdown but looking more like a false signal this time.
P[L1] D[0x0] M[300x250] OOP[F] ADUNIT[] T[]
Soybeans (Cash): The DTN National Soybean Index (NSI.X, national average cash price) closed at $8.70 1/2, down 82 1/4 cents for the month. The NSI.X is another complicated market with its monthly chart showing a number of conflicting signals regarding the major (long-term) trend. However, the sell-off during March took the NSI.X below its low of $8.84 from September 2016, setting up a potential test of the major of $8.05 (March 2016).
Soybeans (Futures): The May contract closed at $9.46, down 89 3/4 cents on the monthly chart. The futures market posted a new 4-mongh low of $9.44 1/4 during March, indicating it could fall back to its major low of $8.44 1/4 (November 2015). However, before that support is pegged at $9.30 1/4, a price that marks the rally from $8.44 1/4 through the June 2016 high of $12.08 1/2.
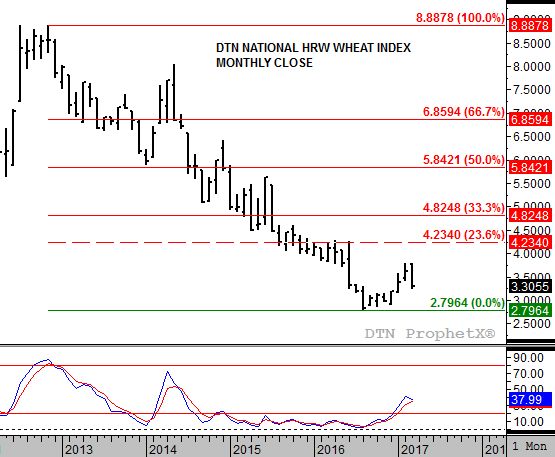
HRW Wheat (Cash): The DTN National HRW Wheat Index (HW.X, national average cash price) closed at $3.30 1/2, down 31 3/4 cents for the month. The HW.X posted a bearish reversal during March, indicating it has returned to a major (long-term) downtrend. Support is at the previous low of $2.79 3/4 from August 2016.
HRW Wheat (Futures): The May Kansas City contract closed at $4.20 1/2, down 43 cents for the month. As with the HW.X, futures posted a bearish reversal during March indicating a return to a major (long-term) downtrend. Support is pegged at the previous low of $3.95 from August 2016.
To track my thoughts on the markets throughout the day, follow me on Twitter: www.twitter.com\DarinNewsom

Comments
To comment, please Log In or Join our Community .