

Canada Markets
A Look at Canola's Chart-Based Resistance
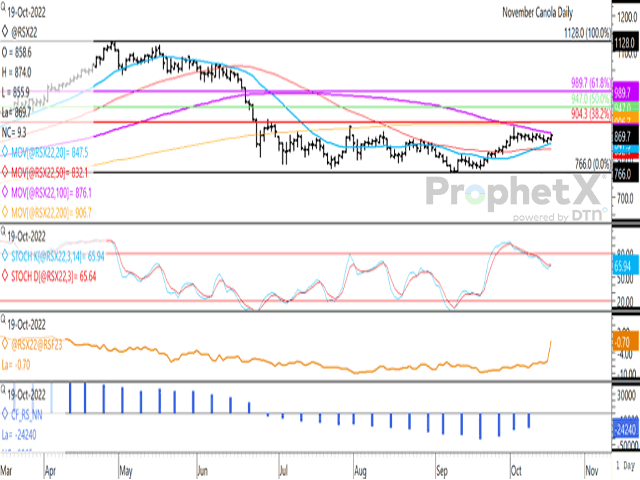
November canola closed higher for a second session on Oct. 19, with a gain of $9.30/metric ton (mt). This is the largest daily move seen since Oct.3, with daily volume of 19,494 contracts in the front month contract the highest reported in five days.
Technical resistance lies at last week's high of $874.60/mt, with Wednesday's high falling just short of testing this level. The contract's 100-day moving average is seen at $876.10/mt (purple line), while we have not seen a close above the 100-day since June 17, or four months.
P[L1] D[0x0] M[300x250] OOP[F] ADUNIT[] T[]
Over the past 16 weeks, three weekly highs ranging from $891/mt to $912.70/mt stand in the way of an upside breakout from the sideways range traded over this period, while psychological resistance at $900/mt may also present a challenge given a further move higher.
One last level of resistance to note is the 38.2% retracement of the move from the contract's April high to September low, which is calculated at $904.30/mt (horizontal red line).
Spreads strengthened Wednesday, with the Nov/Jan spread strengthening to minus $0.70/mt (brown line on the second study), while the Jan/March strengthened to minus $3.30/mt and the March May to minus $3.30/mt, all reflecting a bullish market structure when compared to the true cost of carry over this period. The one-minute chart shows the front-month contract trading in inverted territory prior to today's close.
The blue histogram bars on the lower study show noncommercial traders paring their bearish net-short position for a third consecutive session as of Oct. 11, now holding the smallest net-short position in eight weeks. While not shown, CFTC data shows the noncommercial long position increasing for a fifth week to 15,218 contracts, the largest reported in 16 weeks. While this is down sharply from the record high of 80,537 contracts seen as of the week ended Jan. 11, it is encouraging that the speculative trade has increased activity on the long side of the trade.
Cliff Jamieson can be reached at cliff.jamieson@dtn.com
Follow Cliff Jamieson on Twitter @CliffJamieson
(c) Copyright 2022 DTN, LLC. All rights reserved.

Comments
To comment, please Log In or Join our Community .