Canada Markets
March Spring Wheat Testing Support
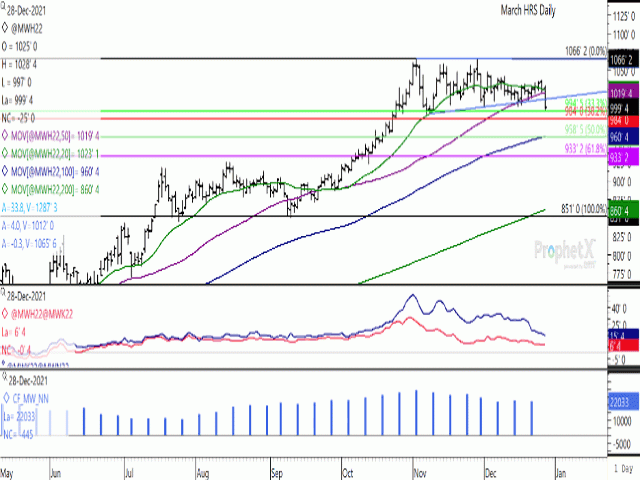
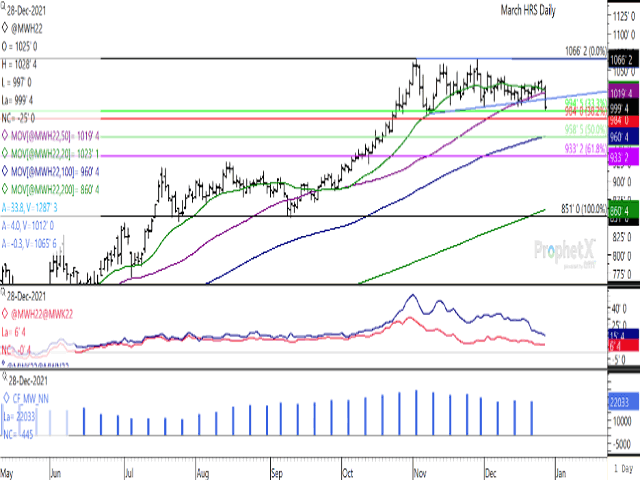
March MGEX hard red spring wheat dipped 25 cents on Dec. 28 trade to close at $9.99 1/2/bushel (bu), closer to the lower end of the sideways range traded during the past two months and reaching its weakest trade in more than six weeks at $9.97/bu. This move follows a bearish outside bar formed on Dec. 27, with the daily close ending below the contract's 20-day moving average.
After trading sideways for the two months, Tuesday's close ended near the lower-end of the range traded during this period, which bears watching.
P[L1] D[0x0] M[300x250] OOP[F] ADUNIT[] T[]
Tuesday's close was below the contract's 50-day moving for the first time in more than three months, or since Sept. 21. In addition, trade dipped below the upward-sloping trendline drawn from Nov. 8 low, with potential support reported at $10.12/bu. At the same time, support was found above the 33.3% retracement of the move from the contract's September low to November high, calculated at $9.94 1/2/bu. A move below this level could lead to a further slide to the 38.2% retracement at $9.84/bu. Potential support may exist at the Nov. 8 low of $9.91 1/4/bu.
As seen with the red line on the lower study, the March/May contract spread weakened 1/2 cent today to a 6 1/2 cent inverse (March over the May contract) which is the weakest inverse seen since July 6. This spread has weakened from 31 1/2 cents reached on Oct. 29 and could signal a weakening in the resolve of commercial traders as we move into the New Year.
The blue histogram bars in the lower study shows noncommercial traders reducing their bullish net-long position for the fifth time in seven weeks. As of Dec. 21, this group held a bullish net-long position of 22,033 contracts, down from the previous week and close to the smallest bullish position seen since Sept. 21 or three months.
Cliff Jamieson can be reached at cliff.jamieson@dtn.com
Follow him on Twitter @Cliff Jamieson
(c) Copyright 2021 DTN, LLC. All rights reserved.


Comments
To comment, please Log In or Join our Community .