Canada Markets
Demand for Prairie Grain Shipping by Corridor for Week 8
During week 8, the largest grain shippers ordered 9,267 hopper cars for loading, a number that has grown higher for six consecutive weeks while to the level that is the highest seen during the first eight weeks of the crop year. At the same time, overall demand for shipping is down 23.4% from the same week in 2020-21 and down 7.9% from the three-year average for this week.
During the first eight weeks of the crop year, total demand is reported by the AG Transport Coalition at 48,107 cars, down 28,570 hopper cars or 37.4% from the same period in 2020-21 and down 25.4% from the three-year average for this week.
P[L1] D[0x0] M[300x250] OOP[F] ADUNIT[] T[]
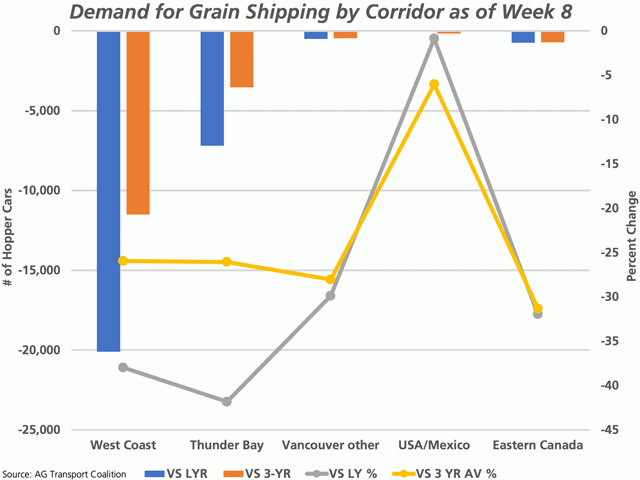
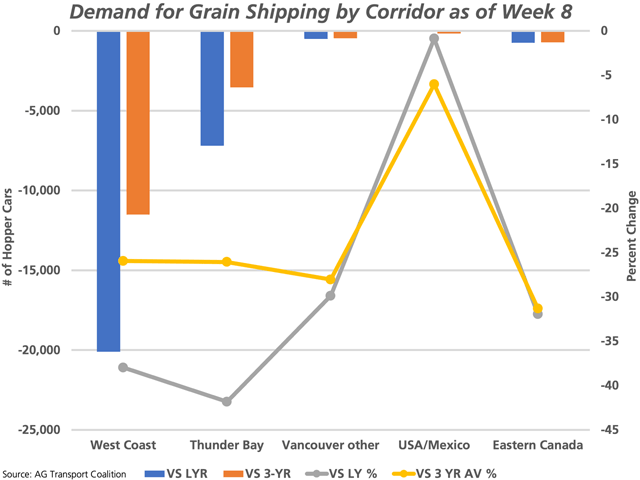
The attached chart shows data for five different shipping corridors, as reported by the AG Transport Coalition, while combining the Vancouver and Prince Rupert data to create the West Coast statistics.
As indicated by the blue bars, measured against the primary vertical axis, the year-over-year change in movement is largest to the West Coast, with cumulative data for week 8 showing a year-over-year drop of 20,102 cars, or 70.4% of the year-over-year change. When the 7,202-car year-over-year drop to Thunder Bay is included, the demand for cars to the western ports is down 27,304 hopper cars, or 95.6% of the total year-over-year drop.
The grey line represents the year-over-year percent change in demand for shipping, which is calculated at 38% lower for the West Coast and 42% lower for Thunder Bay, as measured against the secondary vertical axis.
During the first two months, demand for shipping to the U.S./Mexico is consistent with previous years. This bears watching as the U.S. will be looking to import various grains in the crop year ahead. While the demand for south-bound cars is low relative to the export corridors to the west and to the east, the total demand has reached 2,488 hopper cars over eight weeks, which is down just 22 cars from 2020-21 (1%) and is 160 cars (6%) below the three-year average.
Cliff Jamieson can be reached at cliff.jamieson@dtn.com
Follow Cliff Jamieson on Twitter @Cliff Jamieson
(c) Copyright 2021 DTN, LLC. All rights reserved.


Comments
To comment, please Log In or Join our Community .