

Canada Markets
The Trend in the USDA's Rapeseed/Canola Forecasts

The majority of the world's market watchers will refer to the bearish global data released in the USDA's April World Agricultural Supply and Demand Estimates (WASDE) report for soybeans, which weighed on soybean prices in the April 9 trading session. At the same time, the USDA's Oilseeds: World Markets and Trade report saw less-bullish data reported for global canola/oilseed.
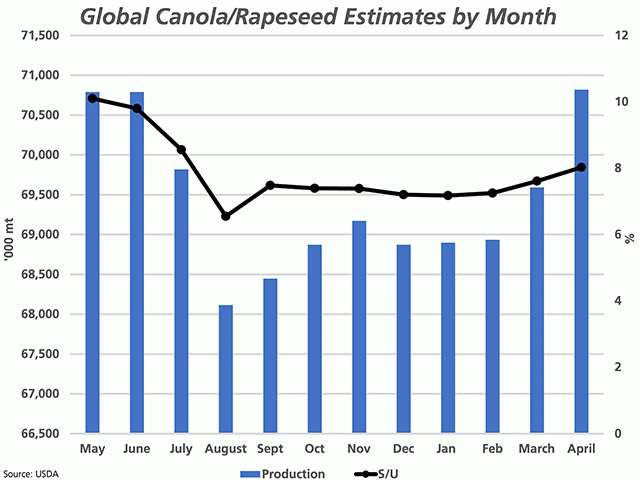
The attached chart shows the trend in the USDA's forecast for global canola/rapeseed production (blue bars) for 2020-21, starting with the first forecast released in May 2020 and ending with today's April 2021 forecast. Since reaching a low of 68.114 million metric tons in August 2020, this global forecast has been revised higher in seven of the past eight months, with the April 2021 report showing the largest month-over-month increase of all at 1.227 mmt to 70.818 mmt. This is the highest production estimate seen during the 12 monthly estimates released.
This month's revision was largely due to a 1.1-mmt upward revision from the previous month's estimate for production in India to a fresh record of 8.5 mmt, up from 7.7 mmt in 2019-20 and their five-year average of 7.068 mmt.
P[L1] D[0x0] M[300x250] OOP[F] ADUNIT[] T[]
This month's estimate of global production of 70.818 mmt is 2% higher than achieved in 2019-20, while just 0.5% lower than the five-year average. If achieved, this would be the third-largest global crop on record, according to USDA data. Meanwhile, the ICE Canada nearby May future hit a fresh contract high this session of $827/mt.
Global ending stocks are pegged at 5.811 mmt, revised higher for a third month while to the largest volume forecast in nine months. The attached chart shows the USDA's global stocks/use ratio reaching a low of 6.55% last August while today's report shows this ratio climb to 8%.
This single-digit stocks/use ratio remains a bullish feature for this market, despite the revised forecasts, while even more so when one looks at the bullish nature of the entire global vegetable oil market. The location of these stocks will also play a large role in determining the direction of this market. While the USDA held steady on Canada's ending stocks at 1.2 mmt, the world's largest exporter, this remains 500,000 mt higher than the 700,000 mt forecast by AAFC. The current pace of disappearance, reported at over 500,000 mt in the most recent week 35 data, could result in even tighter stocks.
This week, the United Nation's Food and Agriculture Organization reported that their Vegetable Oil Price index increased by 8% in March to its highest level in a decade, citing concerns over palm oil, rapeseed, and sunflower oil inventories at a time when the soy oil demand is seen rising.
Cliff Jamieson can be reached at cliff.jamieson@dtn.com
Follow him on Twitter @Cliff Jamieson
(c) Copyright 2021 DTN, LLC. All rights reserved.
Comments
To comment, please Log In or Join our Community .