

Canada Markets
February Revisions to AAFC's Supply and Demand Tables
Agriculture and Agri-Food Canada's February supply and demand tables included the recent official data from Statistics Canada's Dec. 31 stocks report, which has led to demand revisions along with revisions to ending stocks for the 2020-21 crop year. At the same time, some significant revisions were made to preliminary estimates for 2021 seeded acres following the initial release of this data in January.
Looking at AAFC's summary tables for all crops, the end result is a drop of 1.450 million metric tons in ending stocks of all grains and oilseeds for 2020-21 and a 205,000-mt drop in ending stocks of pulse and special crops. The forecast ending stocks for all principal field crops is pegged at 11.765 mmt for 2020-21, down 17% from 2019-20, the lowest reported in eight years and compares to the five-year average of 14.889 mmt.
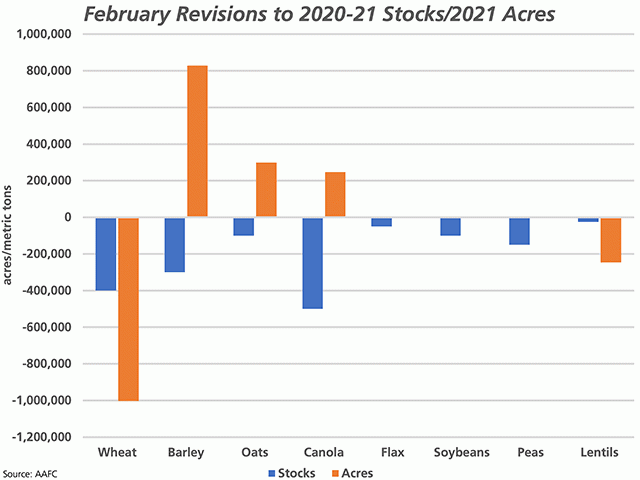
The blue bars on the attached chart highlight the month-over-month change in ending stocks for the major crops selected. The stocks of all crops shown were revised lower this month, with the largest change a 500,000-metric-ton drop in canola's ending stocks for the current crop year, from 1.2 mmt to 700,000 mt.
While canola exports were left unchanged this month, forecast at 10.9 mmt, domestic crush was revised by 700,000 mt higher to 10.2 mmt while the estimate for feed, waste and dockage was revised 200,000 mt lower this month. It is interesting to note that in January, AAFC revised the crush total by 700,000 mt lower to 9.5 mmt in order to hold ending stocks steady at 1.2 mmt; it almost seems like this month's revisions was to fix a mistake. Early this week, NOPA in the U.S. announced a record January soybean crush achieved for the month, signaling that high prices have yet to cure the demand on the vegetable oil side.
While the year-over-year drop seen in canola stocks from the 3.1 mmt estimated for 2019-20 to 700,000 mt in 2020-21 is a massive drop, stocks are still not as low as the 588,000 mt estimate for 2012-13, while reported in the 300,000 to 400,000 range twice in the 1990's and as low as 120,000 mt in 1983-84, while many in the trade are indicating that we are currently on the way to running out of seed.
P[L1] D[0x0] M[300x250] OOP[F] ADUNIT[] T[]
The next-largest revision to stocks was shown for wheat (excluding durum), with ending stocks for 2020-21 revised 400,000 mt lower to 4.9 mmt due to upward revisions in domestic use by the same volume. Coincidentally, the February WASDE report released on Feb. 9 also included a 400,000 mt upward revision to Canada's domestic use. A major difference between the two forecasts is that the USDA has pegged Canada's all-wheat domestic disappearance at 10 mmt as compared to AAFC's 8.5 mmt, with USDA forecasting a much tighter ending stocks estimate of 4.63 mmt as compared to AAFC's 5.850 mmt.
The February estimates point to a modest increase of 137,000 mt of wheat stocks from 2019-20 to 2020-21 along with a 213,000 mt increase in durum stocks, with all-wheat stocks to rise 351,000 mt or 6.4% in 2020-21 given current forecasts to 5.850 mmt.
Some major changes to AAFC's seeded acre forecast were made this month, after the initial forecast was first released in January. After the release of the January estimates, media pieces pointed to the government's pessimistic view of barley acres, while AAFC had also included a modest increase in wheat acres (excluding durum) at a time when wheat is facing competitive pressures in both the U.S. and Canada from a number of alternatives.
The February estimates included an upward revision in forecast seeded acres for 2021 for barley, oats and canola, as indicated by the brown bars on the chart, with by far the largest upward revision an 827,785 acre increase in the forecast for barley. A 1-million-acre downward revision was made to wheat acres (excluding durum) to facilitate this expansion, along with a downward revision in lentil acres of 247,100 acres.
At a forecast 18.523 million acres, the area planted to wheat (excluding durum) will have fallen for a second year and to the lowest area planted in four years. Spring wheat acres will face an even greater hit on a percentage basis, with Statistics Canada forecasting winter wheat acres seeded in the fall of 2020 at 1.5748 million acres, the highest reported in four years. Given current forecasts, wheat ending stocks are to rise by a modest 100,000 mt in 2021-22 (excluding durum), while when combined with durum statistics, all-wheat stocks are to rise by 450,000 mt.
If we consider AAFC's average crop price reported for the current crop year, we see that the average wheat price is forecast to rise by $15/mt from 2019-20 to 2020-21, while the average barley return is up $23/mt, peas up $65/mt, lentils up $115/mt, soybeans up $156/mt and canola is up $171/mt. New-crop wheat futures will need to do some heavy lifting in order to buy acres.
Meanwhile, attractive prices seen for old-crop and new-crop barley as exports to China squeeze prairie supplies and ending stocks are revised lower for 2020-21 is expected to see producers increase barley acres for a fourth year to 7.9 million acres, up 4.2% from 2020 and compares to the five-year average of 6.8 million acres. The current forecast includes a rise in ending stocks in 2021-22 to 900,000 mt but are forecast to remain tight and below 1 mmt for a fourth consecutive year and compares to the five-year average of 1.326 mmt.
This month's data included a 247,100 acre increase in the forecast for 2021 canola acres seeded from the January estimate. At 21.6 million acres, this area would be up 3.2% from 2020, the highest in three years and roughly 100,000 acres below the five-year average. It is interesting to note that 2021-22 ending stocks are left unchanged at 700,000 mt after both export and crush volumes are reported down from 2020-21. The average price is forecast at $600 mt, down from $655/mt in 2020-21, which reflects track Vancouver prices.
Cliff Jamieson can be reached at cliff.jamieson@dtn.com
Follow him on Twitter @CliffJamieson
(c) Copyright 2021 DTN, LLC. All rights reserved.

Comments
To comment, please Log In or Join our Community .