Canada Markets
March Spring Wheat Technical Signals
Nearby spring wheat futures followed winter wheat lower on Wednesday, with March hard red spring (HRS) wheat ending 7 3/4 cents lower at $6.18 3/4/bushel (bu). March hard red winter (HRW) wheat ended 19 1/2 cents lower and March soft red winter (SRW) wheat closed cents 14 cents lower.
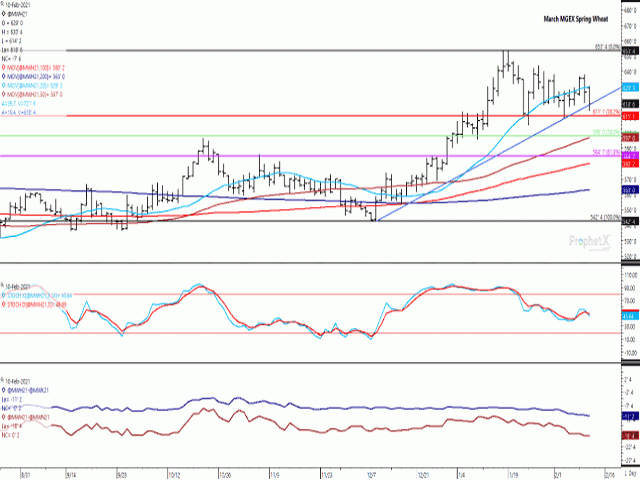
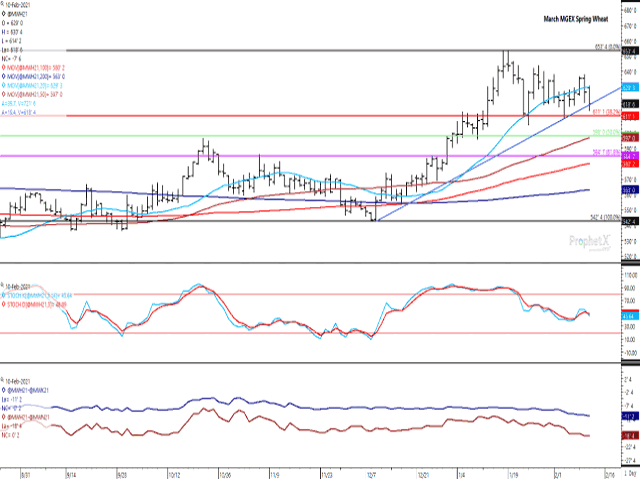
As seen on the attached chart, the March HRS contract reached a contract high of $6.53 1/2/bu on Jan. 19, a lower high of $6.43 3/4 on Jan. 27 and even lower high of $6.38/bu on Feb. 9.
The Feb. 9 session also resulted in a bearish outside-day trading bar formed on the daily chart, trading both higher, then lower than the previous day's low only to close lower.
P[L1] D[0x0] M[300x250] OOP[F] ADUNIT[] T[]
Since Jan. 28, trade in this spring wheat contract has struggled with its 20-day moving average (light blue line), while Feb. 10 trade marks the sixth time in seven sessions where the session's close failed to hold above the 20-day.
The Feb. 10 move has also resulted in a breach of the upward-sloping trendline drawn from the Dec. 9 low, with support on this line shown at $6.18 1/2/bu. Late-session buying interest boosted today's close above this line, although the session's close was only 1/4 cent above this support.
Potential support on this chart is also seen at $6.11/bu, as shown by the horizontal red line, which represents the 38.2% retracement of the move from the contract's December low to its January high. A breach of this line could result in a further slide to $5.98/bu, the 50% retracement of the December-through-January uptrend. Potential support may also be seen at the contract's 50-day moving average, seen at $5.97/bu.
The first study shows the stochastic momentum indicators rolling over while near the middle of the neutral zone on the chart. Prices are struggling to sustain an upward trajectory.
The lines on the second study shows weakening futures spreads, with the blue line showing the March/May spread that has weakened 3/4 cent so far this week to minus 11 1/4 cents and the brown line representing the March/July spread that has weakened 1/2 cent to minus 18 1/2 cents, or more than 4 cents/month and representing a bearish level of carry.
Troubling chart signs is seen here despite the USDA's upward revision in U.S. spring wheat exports this month and a tightening in Canada's all-wheat stocks due to increased feed usage which bears watching.
Cliff Jamieson can be reached at cliff.jamieson@dtn.com
Follow him on Twitter @CliffJamieson
(c) Copyright 2021 DTN, LLC. All rights reserved.


Comments
To comment, please Log In or Join our Community .