Canada Markets
Seeded Acre Changes From March Intentions to Final Report
Statistics Canada's Principal field crop areas report is set for release on May 7 given the agency's release schedule. Over the past five years, this report has been released between April 21 and April 27, averaging the 23 of April.
Over the past two years, this report has been based on surveys conducted over the month of March, while in the previous three years (2015-2017), was based on surveys conducted over the last half of March. This year's delay may have pushed surveys into the month of April that may have allowed the agency to capture changes in intentions due to upward price moves in crops such as durum, peas and lentils, along with weakening corn futures as the reduction in demand linked to the COVID-19 lockdown collided with the Saudi-Arabia-Russia price war that has weighed on the ethanol sector.
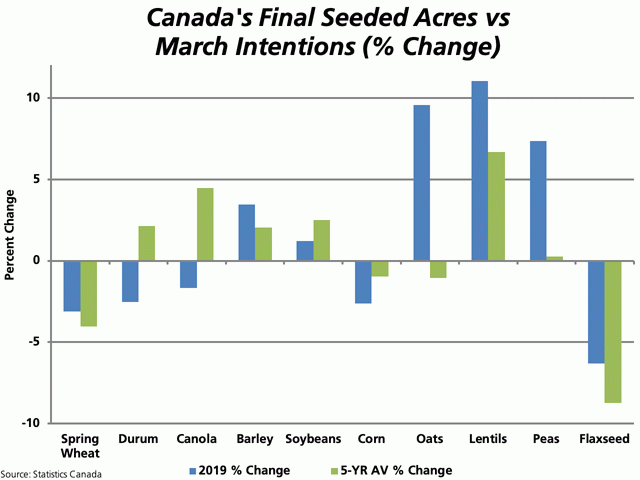
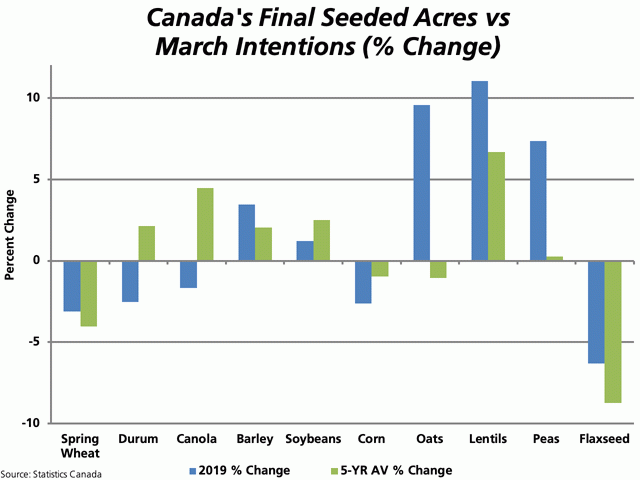
The attached graphic keys on the percent change seen in seeded acres from the acres estimated based on March intentions in the spring to the final estimated acres reported by Statistics Canada. This change is shown for both 2019 (blue bars) and the five-year average (green bars.)
Of the 10 crops selected, the percent change from the spring report to the final acres was seen taking place in the same direction in 2019 as well as the five-year average for seven of the 10 crops. For example, the final estimate for acres seeded to spring wheat was 3.1% below the March estimate in 2019 and 4% lower on average over the past five years. As well, the final acres seeded to lentils were 11% higher than reported in the March intentions report in 2019, while averaged 6.7% higher over the past five years.
P[L1] D[0x0] M[300x250] OOP[F] ADUNIT[] T[]
Canola can be seen as one of the three crops where the 2019 change was not in the same direction as the five-year average change. While the final 2019 acres seeded to canola were 1.7% lower than the March estimate, the five-year average points to a 4.5% increase in acres seeded to canola, reflecting the change from the spring estimate to the final estimate.
From the data presented, the largest upward revisions are shown for Canada's lentil crop, while the largest downward revision is seen in flax. In 2019, the final acres seeded to flax were 6.3% lower than the March estimate, while on average, were 8.7% lower.
Over the five years in question, the average percent change shows the final corn acres down 1% from the March intentions, also equal to the average drop shown in oat acres, while the final dry pea seeded acre estimate averaged just .3% higher than the March intentions. These are the three crops where the average change is the smallest of the selected crops.
The crops showing the greatest consistency over the five years are spring wheat and flax, where the final acres were less than the March intentions estimate in each of the five years from 2015 through to 2019.
DTN 360 Poll
This week's poll asks what you think of the move to delay the release of ag reports by Statistics Canada as shown in their revised schedule due to COVID-19. You can weigh in with your thoughts on this poll, found at the lower right of your Canadian site Home Page,
Cliff Jamieson can be reached at cliff.jamieson@dtn.com
Follow Cliff Jamieson on Twitter @Cliff Jamieson
© (c) Copyright 2020 DTN, LLC. All rights reserved.


Comments
To comment, please Log In or Join our Community .