
Kub's Den
Soybean Futures Volatility Is Up, Any Way You Measure It
If ever there was a time when it would be appropriate for the soybean market to flail up or down by double digits every day (up 66 cents, up 19 cents, down 20 cents, down 10 cents, down 13 cents, down 41 cents, up 31 cents) -- well, this is that time, when U.S. production prospects hinge on desperately needed rain forecasts that either materialize or disappoint day by day. It's also more natural to see double-digit daily movements when the underlying price tag is already so high. A 30-cent day is a 2% move when soybeans are $13.50 per bushel but would represent more than 3% of the price tag if this was a year ago, when soybean prices were less than $9.00.
When we say a market is "volatile" that could mean several things, because there are many ways to compare just how volatile a market is, either against other markets or against itself over time.
The most basic definition of volatility is probably the historical standard deviation of a market's returns. Standard deviation is the square root of the average variance of the data from its average. Over the past 21 trading sessions (the past month of time), the average daily return in the soybean market has been negative 0.5%, but each daily return has varied from that figure (anywhere from negative 7.9% on Thursday, June 17, to positive 2.8% on the first Friday of the month) -- wild swings above and below the expectation, which we therefore call volatility. The standard deviation of these 21 daily returns was 2.6%. When we assume that pattern could continue for an entire year and annualize the standard deviation, given a 251-session trading year, then we get the basic "volatility" measurement of today's soybean market: 0.41, or 41%.
That's really volatile.
In comparison, the soybean market's volatility a year ago was about 10%, and it has been staying between about 8% and 25% since 2016. Its peak in September 2014 was 56% and its all-time peak in 2008 was 122%, which seems like a logical impossibility, but that's just a function of the statistical assumptions made when annualizing volatile daily performances.
P[L1] D[0x0] M[300x250] OOP[F] ADUNIT[] T[]
Compared to soybeans today, the corn market is even more volatile in terms of annualized daily returns at 44%. The Minneapolis spring wheat market had a volatility of 44% at the start of this month but has since calmed down, relatively speaking, to only 35%.
However, what has happened during the past 21 trading sessions isn't necessarily the correct measure of how "volatile" a market will be today or in the future. Therefore, another widely used measure of volatility is the forward-looking "implied volatility" from options trading. Essentially, if we know the September soybean futures price is $13.16, and we know $13.00 strike September call options are trading at $0.80 (and we know the interest rate and the options' time until expiration), we can go backward through the Black Scholes options-pricing model to solve for volatility and see that options traders are assuming the September soybean futures market will have a volatility of 27% during their investment horizon, give or take some wiggle room to account for all the other implications from all the other put and call options being traded.
This forward-looking measure of volatility currently shows options traders aren't expecting soybean market volatility to be quite as rambunctious as it has been lately: the implied volatility from the nearby options markets are about 27%. For corn, however, the options trade is still implying volatility of 43% to 44%.
There are other metrics used to express volatility in financial markets, like maximum drawdown or beta, but these only make sense to use when comparing assets against each other and are pretty nonsensical in a commodity market context. But another classic -- Value at Risk -- does provide a nice visualization for market participants to think about risk. For instance, given the recent performance of the S&P 500, with average daily returns of 0.1% and a standard deviation of about 9%, if you had a $100,000 portfolio invested in that asset, then 5% of the time you could expect an annual loss of at least $12,000. That's your value at risk, given the current level of volatility in that market.
Unfortunately, Value at Risk calculations become laughable for soybeans when they are as volatile as they are today. For one bushel of soybeans currently worth $13.61, with average daily returns of negative 0.5% and a standard deviation of 41%, we might say 5% of the time we could expect an annual loss of at least $9.40.
So, am I saying there's a 5% chance the price tag could fall within a year from $13.61 to $4.21? No, but that's the result of the most basic parametric Value at Risk calculation, based on the normal statistical distribution and not accounting for the fact that we are currently in unusual times with these huge daily swings -- far into the fat tails of a statistical distribution which, in reality, is not normal. We could run a better Value at Risk calculation with a Monte Carlo simulation using a different statistical distribution, but the result would be effectively the same: the price tag on a bushel of soybeans may or may not fall, a lot, within the next year.
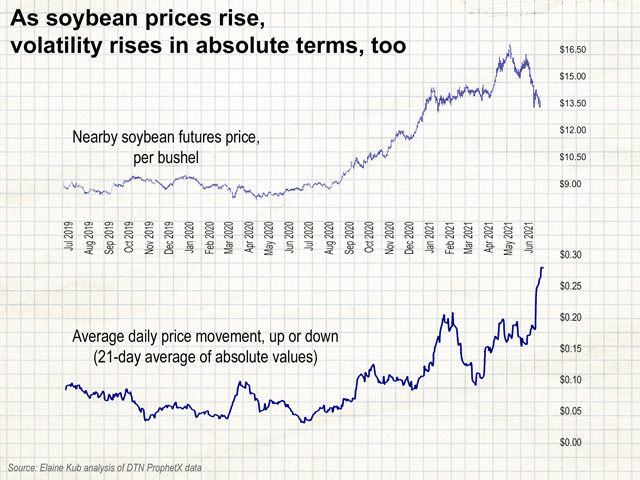
Therefore, honestly, I prefer to communicate how volatile a grain market is by simply reporting the average daily price movement, up or down, in cents per bushel. This is sort of what standard deviation measures, but it's in a format that's easier for my feeble mind to understand. When I say the average daily price movement in soybeans has been 27 cents either up or down, you know just what I mean. I took the absolute values of the past 21 daily performances (up 66 cents, up 19 cents, down 20 cents, down 10 cents, down 13 cents, down 41 cents, up 31 cents) and averaged them.
If this keeps up, then on any given day we can expect the soybean market to swing either up or down by about 27 cents. This is quite different than a year ago, when on any given day you could expect the soybean market to move up or down by an average of 3 cents per bushel. Typically, through recent history, this average price movement stays less than 10 cents per bushel per day. Now, because the recent swings have kept up for so long -- not just that one day of $1.19 losses but an extended series of big movements -- soybean market volatility is indeed remarkable, by this metric or by any other.
**
Comments above are for educational purposes only and are not meant as specific trade recommendations. The buying and selling of grain or grain futures or options involve substantial risk and are not suitable for everyone. Market examples are not recommendations for trades. Past performance is not indicative of future results.
Elaine Kub is the author of "Mastering the Grain Markets: How Profits Are Really Made" and can be reached at masteringthegrainmarkets@gmail.com
(c) Copyright 2021 DTN, LLC. All rights reserved.

