

Fundamentally Speaking
End of August U.S. Corn Rating Actually Portends Above Trend Yield

The end of August (week 34) crop rating for the U.S. corn crop rose by 1% in the combined good or excellent categories to 57%, matching the high of the year but still the lowest rating for this point in the growing season since 2012.
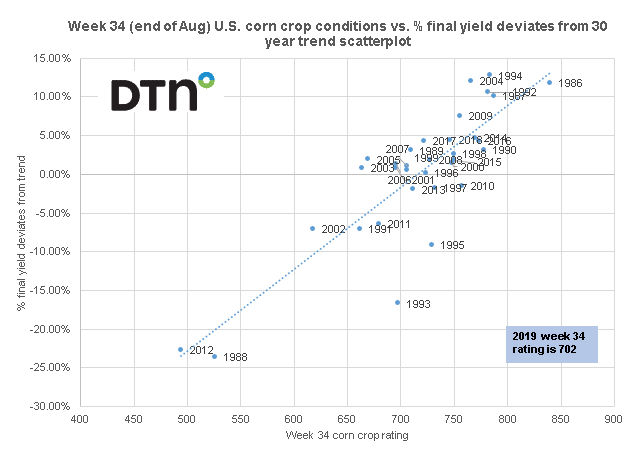
This graphic is a scatterplot of end of August corn conditions vs. the percent that the final U.S. corn yield deviated from the 30-year trend.
Crop conditions are measured using our usual ratings system where we weight the crop based on the percent in each category and assign that category a factor of 2 for very poor, 4 for poor, 6 for fair, 8 for good, and 10 for excellent and then sum the results.
P[L1] D[0x0] M[300x250] OOP[F] ADUNIT[] T[]
This year's end of August or week 34 rating is 702, the lowest since a 494 figure was seen in 2012.
Plugging that 702 number into the derived trend line formula (% deviation from trend = 0.0011 * end of August crop rating + 0.7558) results in a 2019 calculated yield 1.6% above trend.
With 2019 trend at 176 bushels per acre (bpa) this does equate to a 2019 yield of 178.8 bpa, well above the last USDA figure of 169.5 bpa.
Note that end of August crop conditions explain about 74% of the variability of percent of yield deviation though it is a long way until the crop is in the bin, especially with much of the crop developing very late.
What is interesting is the last time ratings were near this level was in 2007 at 706; final yield that year was right at trend.
In 2006, the week 34 rating was 696 and final yields that season were 1.3% above trend.
More interesting is the fact that in 1993 the week 34 rating was 698 and yields that season fell 16.8% below trend and 1993 was also a year that saw heavy spring rains as was the case this season.
(KLM)
© Copyright 2019 DTN/The Progressive Farmer. All rights reserved.
Comments
To comment, please Log In or Join our Community .