
Fundamentally Speaking
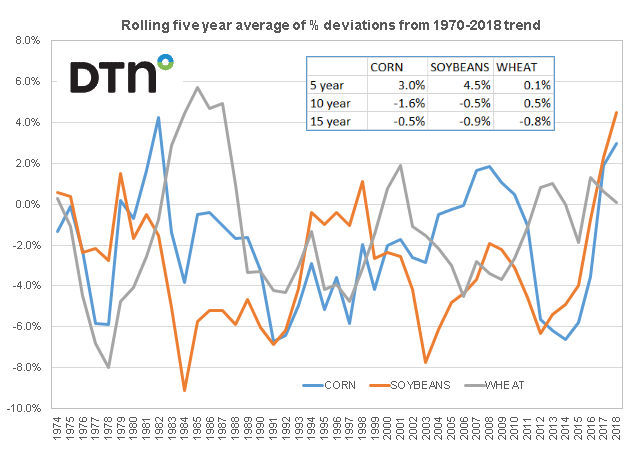
Rolling 5-Year Avg of Percent Deviations for Corn & Beans
The annual USDA Agricultural Outlook Forum takes place this week where the government will unveil its first take on 2019 planted acreage for the various crops and its initial 2019/20 balance sheets for the corn, soybean and wheat markets.
We are particularly interested in the USDA initial yield calculations in light of the recent impressive performance over the past few years as there appears to be an upward paradigm shift in U.S. crop yields, especially for corn and soybeans.
P[L1] D[0x0] M[300x250] OOP[F] ADUNIT[] T[]
Consider that final corn and bean yields have exceeded USDA yield projections given at their February Outlook Forum sessions every year for the past five.
Not only have corn and soybean yields been above trend every year since 2014, but their respective five year rolling average of percent deviations from the 1970-2018 trend for soybeans is plus 4.5%, the highest ever and corn at plus 3.0%, the most positive differential since 1982.
We have mentioned before that scientists are doing some great things in the lab to develop corn and soybean seeds that are not only resistant to pests and diseases but also making them more tolerant to adverse growing conditions and when weather is right, blowing the top off yields on the upside.
The table imbedded within the graph shows the 5, 10 and 15-year averages for the percent that yields deviated from the 1970-2018 trend.
A key question is whether the generally positive growing conditions (temperatures, precipitation, soil moisture levels) seen over the past five years that have aided the technological improvements in yields will continue in 2019.
(KA)

Comments
To comment, please Log In or Join our Community .