

Canada Markets
Canada's August-December Wheat Exports
Weekly Canadian Grain Commission data has shown Canada's wheat exports (excluding durum) well-ahead of the government's forecast pace. As of the most recent week 25 Grain Statistics Weekly, we see cumulative exports at 10.1655 million metric tons (mmt), up 637,400 metric tons (mt) or 6.7% from one year ago, while the current government forecast is pointing to a 3% drop year in exports year over year.
With one week's data pending for the first half of the 2023-24 crop year, movement through licensed facilities is ahead of the pace needed to reach the current 20 mmt export forecast released by Agriculture and Agri-Food Canada (AAFC) in January. Continuation at the current pace would result in crop year exports of close to 21 mmt, which would be a record volume for wheat (excluding durum).
This week's Canadian Grain Commission release of the Exports of Canadian Grain and Wheat Flour report for December shows 9.1049 mmt exported through licensed facilities as of December or over the first five months of the crop year, up from 8.0648 mmt for the same period in 2022-23. Export data for both years shows exports to 51 destinations.
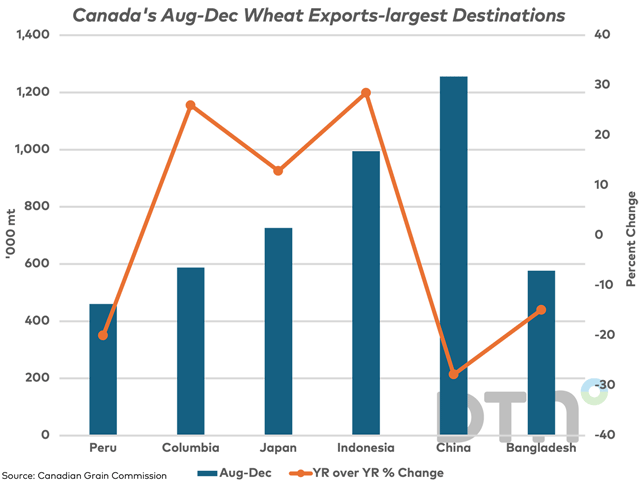
The blue bars on the attached chart show the cumulative volumes shipped to the six largest destinations during the first five months of 2023-24, which also happen to be the six largest destinations for Canadian wheat shipments over the 2022-23 crop year.
P[L1] D[0x0] M[300x250] OOP[F] ADUNIT[] T[]
Volumes have increased year over year in three of the six countries, including a 12.9% increase in the volume shipped to Japan, a 26% increase in shipments to Columbia and a 28.5% increase in the volume shipped to Indonesia.
At the same time, the year-over-year volume to the largest destination, or China, has fallen by 27.8% year-over-year to 1.2557 mmt. A year-over-year drop was seen in the volume shipped to Peru of 20% and a 14.9% drop is seen in the volume shipped to Bangladesh.
It's hard to know just how long this pace can be sustained, although Statistics Canada's Dec. 31 stocks report due for release on Feb. 8 may provide some insight into available supplies for the second half of the crop year.
An interesting reminder of the intense competition seen in global wheat markets is seen in the USDA's recent attache report on Mexico. The USDA Foreign Agriculture Service estimates Mexico's wheat imports from the U.S. falling by 1.3 mmt from 2022 to 2023, to 2.7 mmt, while imports from Canada increased by 312,973 mt to 874,054. Meanwhile, imports from Russia increased by 492,865 mt or 200% from one year to the next.
Recent news points to China and Argentina also coming to terms that will allow Argentina wheat to be imported by China. Competition in this market can only increase.
Cliff Jamieson can be reached at cliff.jamieson@dtn.com
Follow him on X, formerly known as Twitter, @CliffJamieson
Cliff Jamieson can be reached at cliff.jamieson@dtn.com.
Follow him on X, formerly known as Twitter, @CliffJamieson.
(c) Copyright 2024 DTN, LLC. All rights reserved.

Comments
To comment, please Log In or Join our Community .