

Canada Markets
Licensed Deliveries During the first Half of 2022-23
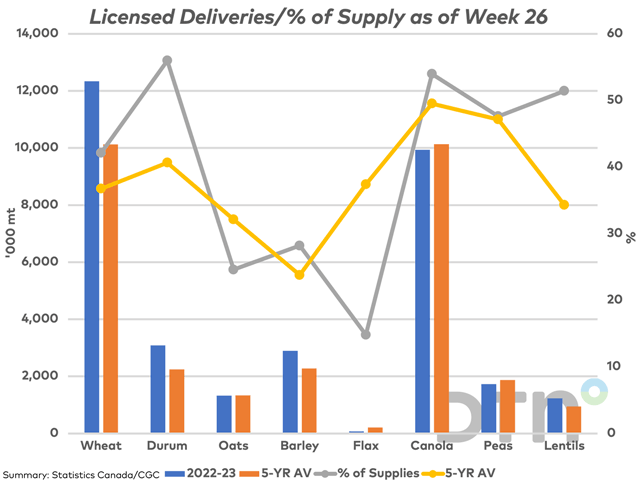
During the first 26 weeks or first half of the 2022-23 crop year, producers have delivered 34.018 million metric tons (mmt) of all principal field crops into the licensed handling system, 32.9% higher than the same period in 2021-22 and 11% higher than the five-year average. Across the 15 principal field crops reported weekly by the Canadian Grain Commission, cumulative deliveries of all crops are higher except for flax, down 45.5%, and corn, down 10% from one year ago.
Of the crops selected for this study, the largest year-over-year increases are seen in wheat deliveries, up 52.4% from last year and 21.9% above the five-year average, durum deliveries, which are up 88.9% from last year and 37.5% above the five-year average, and lentils, with bulk deliveries up 79.3% from last year and 29.9% above the five-year average.
Despite the significantly larger crop harvested in 2022, canola deliveries at 9.938 mmt are up only 13.6% from 2021-22, while are 1.9% lower the five-year average, as indicated by the blue bar slightly lower than the brown bar.
P[L1] D[0x0] M[300x250] OOP[F] ADUNIT[] T[]
The grey line on the attached chart represents the cumulative volume delivered to licensed facilities as a percentage of the total volume available for delivery. The high reached on this chart is seen for durum, with 56% of available supplies delivered into licensed facilities during the first 26 weeks, based on current estimates of July 31 2022 farm stocks and Statistics Canada's 2022 production estimates. This is up from the 51.5% delivered last year and the five-year average of 40.7%.
Also at the high end of this calculation is canola, with 54% of available stocks delivered, and bulk lentils, with 51.4% of available supplies delivered. The percentage calculated for canola is slightly higher than the five-year average of 49.5%, while the percentage of bulk lentil deliveries is 17.1 percentage points higher than average, the widest percentage-point spread seen across the crops shown.
Total deliveries of flax represent 14.8% of estimated supplies, which is down sharply from the five-year average of 37.4%, as seen with the wide spread between yellow and grey lines.
Wheat deliveries (excluding durum) represent 42% of estimated supplies, above the five-year average of 36.8%, a higher percentage than calculated for any year in the past five years.
Despite the higher deliveries reported, primary elevator stocks are reported at 3.938 mmt, up only 1.5% from the same week in 2021-22 and 2.1% below the five-year average. This volume represents 71.6% of the Grain Marketing Program's estimated primary elevator working capacity on the prairies, with space viewed as good.
Cliff Jamieson can be reached at cliff.jamieson@dtn.com
Follow him on Twitter @Cliff Jamieson
(c) Copyright 2023 DTN, LLC. All rights reserved.

Comments
To comment, please Log In or Join our Community .