Canada Markets
Projected 2020-21 Exports Based on Historical Movement
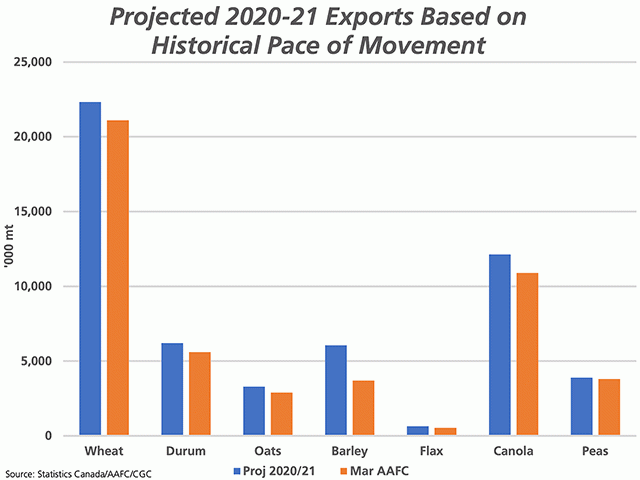
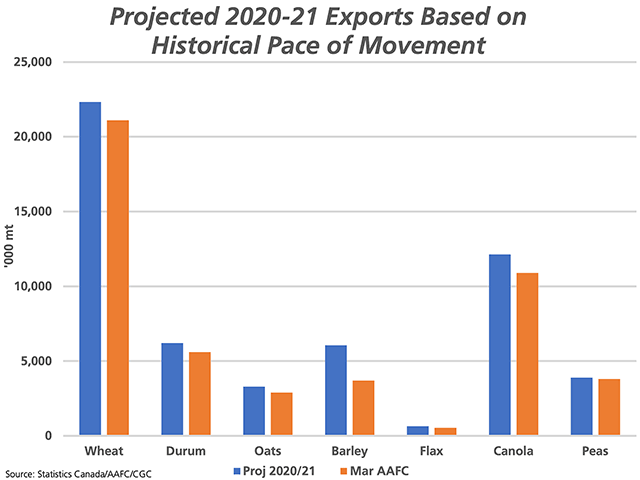
The attached chart indicates the potential for 2020-21 exports based on the Canadian Grain Commission's week 36 cumulative licensed exports and the five-year average pace of movement. Of course, history may have no bearing on what happens over the balance of the crop year; front-end global demand seen this crop year may result in a slowing of activity late in the crop year. As well, projections for several commodities are simply unattainable due to the lack of available exportable supplies.
Following solid exports of 456,200 metric tons of wheat (excluding durum) in week 36, or the week ending April 11, the 69% mark of the current crop year, cumulative exports are reported at 13.7133 million metric tons. This is up 26% from the same period one year ago, while 25.2% higher than the five-year average. Canada's wheat exports tend to be weighted heavier towards the late months of the crop year. During the past five years, the Canadian Grain Commission's week 36 cumulative exports accounted for an average of 61.4% of total crop year exports. In 2019-20, this fell as low as 57%. Based on the average, crop-year exports projected forward would reach 22.3 mmt, above Agriculture and Agri-Food Canada's 21.1 mmt forecast. It is interesting to note that while AAFC and the USDA forecast similar all-wheat exports for Canada at 26.7 mmt and 27 mmt respectively, AAFC forecasts Canada's all-wheat stocks at 5.3 mmt, while the USDA forecasts all-wheat stocks at 4.3 mmt.
Canada's durum exports in week 36 totaled 99,000 mt, the second-lowest volume shipped in the past eight weeks but still higher than the volume needed this week in order to reach the current export forecast of 5.6 mmt. Cumulative exports total 4.2229 mmt, up 26.7% from last year and 41.1% above the five-year average.
P[L1] D[0x0] M[300x250] OOP[F] ADUNIT[] T[]
During the past five years, an average of 67.9% of total durum exports were reported as of week 36 data from the CGC. This ranges as high as 80% in 2019-20. The average pace of movement would point to exports of 6.215 mmt, higher than the current AAFC forecast of 5.6 mmt, although current stocks are forecast at 860,000 mt and exportable supplies will be a limiting factor.
As of week 36, Canada's oat exports total 1.3991 mmt, up 17.2% from last crop year and 36.5% higher than the five-year average. On average during the past five-years, week 36 licensed exports accounted for 42.5% of total exports, which includes oat products. The average pace of movement during the past five years would project forward to 3.290 mmt of total exports in 2020-21, slightly higher than the current 2.9 mmt forecast. Current forecasts show oat stocks falling to 400,000 this crop year, with exportable supplies a limiting factor to reach this forecast.
Barley exports as of week 36 total 2.796 mmt, up 88.9% from the same period last crop year and 124.5% higher than the five-year average. During the past five years, week 36 licensed exports have accounted for an average of 46.1% of total crop year exports, with the total including the export of malt and other products. This projects forward to crop year exports of 6 mmt, an impossibility given the supplies available and above the current AAFC forecast of 3.7 mmt which is forecast to lead to tight stocks of 600,000 mt. Barley exports have yet to slow, however, with 153,300 mt shipped in week 36, the second-highest volume exported of the 15 crops reported weekly by the CGC in week 36 and second only to wheat exports.
Flax exports as of week 36 total 248,300 mt, up 132.2% from the same 36 week period in 2020-21 and 29.6% higher than the five-year average. During the past five years, Canada's flax exports are clearly weighted to the back end of the crop year, with an average of 38.3% of total crop year exports shipped as of week 36. In 2019-20, only 30.6% of crop-year exports were shipped as of week 36. The average pace of movement would project forward to 648,000 mt of crop year exports, just over 100,000 mt higher than the government's forecast of 540,000 mt, although the current forecast is pointing to ending stocks of just 50,000 mt, once again limiting potential.
Canola exports in week 36 were reported at 109,700 mt, the lowest volume shipped in eight weeks. Meanwhile, cumulative exports of 8.3 mmt are up 20.6% from last crop year and 18.3% higher than the five-year average. As of week 36 during the past five years, an average of 68.4% of crop year exports have been achieved, while 68.5% in 2019-20; this data would suggest that exports tend to flow evenly over much of the crop year. This average pace of movement would project forward to 12.1 mmt of crop year exports, although available supplies will be the limiting factor.
Dry pea exports total 2.1176 mmt as of week 36, up 20.6% from the previous crop year and 17.6% higher than the five-year average. Exports tend to be weighted late in the crop year, with an average of 54.3% of crop year exports reported as of the CGC's week 36 cumulative data, although this fell to 41% in 2018-19 and 47% in 2019-20. This pace projects forward to 3.9 mmt of total crop year exports, very close to AAFC's current 3.8 mmt forecast although available supplies will be tested.
Cliff Jamieson can be reached at cliff.jamieson@dtn.com
Follow him on Twitter @Cliff Jamieson
(c) Copyright 2021 DTN, LLC. All rights reserved.


Comments
To comment, please Log In or Join our Community .