Land Values Continue to Rise
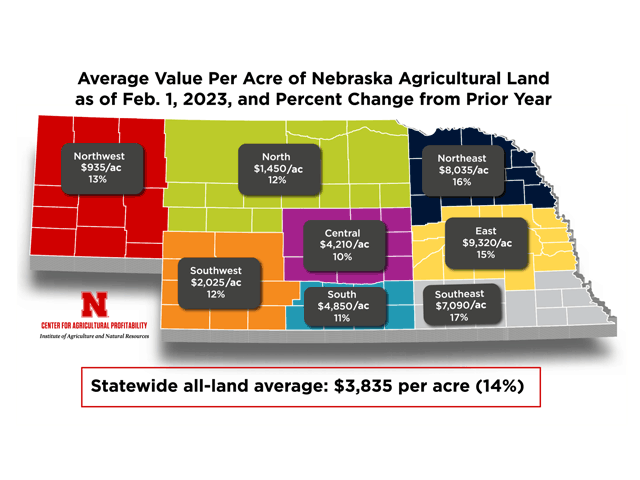
Nebraska Farm and Ranch Land Values Climbed 14% in 2022
MT. JULIET, Tenn. (DTN) -- Agricultural land values in Nebraska climbed 14% from 2022 to 2023 to $3,835 per acre. That average includes seven land classes that include everything from center-pivot irrigated row-crop farms to grazing land.
The estimated total market value of Nebraska's agricultural land and buildings rose an estimated $23.8 billion over the past year to $191.8 billion.
That's according to the 2022-23 Nebraska Farm Real Estate Market Highlights report published by the Center for Agricultural Profitability at the University of Nebraska. The report includes survey and sales data compiled from nearly 200 certified appraisers, professional farm managers, agricultural lenders and others with knowledge of land sales and cash rental rates.
Respondents said higher crop prices, farm expansion and non-farmer investor interest helped fuel the rise in prices, while higher interest rates, property tax levels and input prices kept gains in check.
"Rising interest rates were implemented to combat inflation, but concerns about rising expenses saw many operations acquiring tangible assets to hedge their purchasing power," said Jim Jansen, an agricultural economist and co-author of the report.
"Operators and investors use land purchases to hedge against inflation and grow farms or ranches. Higher interest rates may impact agricultural real estate markets without additional profitability to offset the rising financing expense.
Here are a few of the report's highlights.
REGIONAL BREAKDOWN
-- Rates of increase were highest in the northeast, east and southeastern districts, where farmland values climbed 15% to 17% from the year before.
P[L1] D[0x0] M[300x250] OOP[F] ADUNIT[] T[]
-- Western regions, including the northwest, north, central, southwest and south districts reported smaller increases ranging between 10% and 13%. The central district reported the smallest increase at 10%.
AVERAGE PRICE BY LAND TYPE
| LAND TYPE | $/ACRE | % CHANGE |
| ALL LAND AVERAGE | 3,835 | 14 |
| CENTER PIVOT IRRIGATED CROPLAND | 8,760 | 13 |
| GRAVITY IRRIGATED CROPLAND | 7,905 | 12 |
| DRYLAND CROPLAND (IRRIGATION POTENTIAL) | 6,070 | 16 |
| DRYLAND CROPLAND (NO IRRIGATION POTENTIAL) | 4,395 | 13 |
| GRAZING LAND (TILLABLE) | 1,680 | 14 |
| GRAZING LAND (NONTILLABLE) | 1,090 | 15 |
| HAYLAND | 2,210 | 17 |
CASH RENT
The report breaks out cash rents by land type for each agricultural district and includes details for high- and low-quality land. In general, the report shows steady to higher rental rates for cropland.
-- Dryland cropland cash rent increases ranged from 4% higher in the east to 17% in the north.
-- Irrigated cash rental rates trended at a similar rate for the reporting year. Increases for center-pivot irrigated cropland ranged from 2% in the southwest to 13% in the south district.
-- Pasture rental rates trended from 4% to 13% higher per acre.
INTERESTING FACTS
-- 49% of sales were paid for with cash, while 48% were purchased with a mortgage.
-- Estates comprise 41% of sellers. Active farmers accounted for 20% of sales, while 11% were farmers that were quitting the business. Local non-farmers represented 17% of sellers.
-- Active farmers and ranchers purchased 73% of the land put up for sale. Local non-farmers bought 16%, while non-local residents and out-of-state buyers accounted for 11%.
-- Over the past five years, dryland cropland with irrigation potential and center pivot irrigated cropland increased by 42% and 43%, respectively. Tillable and nontillable grassland reported increases ranging from 31% to 34% during this period.
You can find the entire report here: https://cap.unl.edu/….
Katie Dehlinger can be reached at katie.dehlinger@dtn.com
Follow her on Twitter at @KatieD_DTN
(c) Copyright 2023 DTN, LLC. All rights reserved.


