

USDA Reports Review
USDA Finds Mixed Acreage Changes Hidden in FSA Data
The trade focus for Tuesday's NASS Crop Production report was primarily on national average yield, and the extent to which prospects had shifted from August.
You will recall early August was fairly wet and cool, while the last half of the month and early September were hotter and drier than normal for most of the Corn Belt, and in fact most of the U.S. acreage. Over 7,000 farmer surveys were completed for this report, as late as Sept. 7. USDA field personnel also checked 3,930 objective yield plots between Aug. 25 and Sept. 1, although the latter were mostly for ear and pod counts due to the crop not being mature enough to harvest grain.
Traders did a pretty good job in anticipating the yield estimates from NASS. The average trade guess for corn was 173.5 bushels per acre (bpa), and NASS found 173.8 bpa. For soybeans, traders were at 50.1 bpa and NASS used 50.1. That's a bullseye!
So, why did we act so surprised when the USDA numbers came out, with corn settling 6 1/4 to 9 3/4 cents lower and soybeans dropping 13 to 22 1/2 cents? Production is yield times acreage, and the other multiplier changed!
P[L1] D[0x0] M[300x250] OOP[F] ADUNIT[] T[]
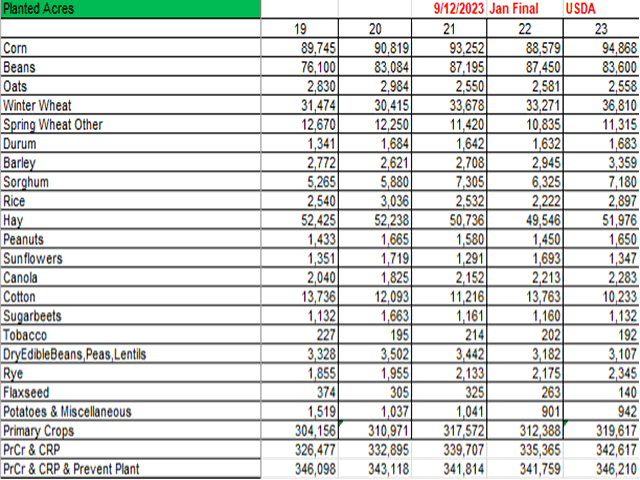
You will recall that USDA shocked the trade with a big June 30 Planted Acreage jump for corn, and that soybeans rallied 78 1/4 cents because USDA didn't find meaningful bean acres. That corn increase versus March Intentions was assumed at the time by some to be too big, and likely to be revised downward. Trader sentiment was that it couldn't get worse. Comedian Bill Cosby had a routine about losing money in Las Vegas we nicknamed "Don't Ever Challenge Worse," as in, it can't possibly get worse. We all know how that turned out for him!
From a price standpoint, it got worse for corn Tuesday, as USDA hiked corn planted area about 800,000 acres after comparing the NASS state-level data to the FSA Planting and Prevented Planting numbers. For corn, area harvested for grain is now expected to be up 10% from 2022 despite the derechos, more hail than in an average year and some widely publicized dryland crop failures. We conclude that price (highest since 2013) makes an excellent fertilizer!
For soybeans, planted and harvested acres were both up 1% from last month in Tuesday's report, but still down 4% year over year.
All acreage revisions are not upward revisions. USDA found 8% fewer cotton acres were actually planted than NASS believed based on the August farmer surveys. Planted area for cotton in 2023 is down 24% from last year, with modestly lower average cash prices coming off a decade-plus high in 2021-22.
Could final corn acres creep even higher than the September revisions? The ratio of FSA September to final numbers suggests NASS could ultimately be a skosh above 95 million, at 95.090 million. Nearly all acres should be accounted for, based on our running total of primary crops plus CRP plus Prevent Plant. Tuesday's Prevented Planting number across all crops is 3.594 million acres, compared to 6.394 million in September 2022. The 2023 CRP numbers won't be announced until October or later, but some categories have been running above a year ago. We slugged in 23 million for our table.
Besides the FSA-driven acreage adjustments, some analysts may have overlooked higher plant populations and ears per acre in 2023. Producers were trying to optimize production with the highest prices in a decade. Corn plant populations per acre were the largest for September since 2018 in the 10 objective yield states. Our Virtual Corn Tour data in August suggested a narrower average row width (i.e. more producers using 20" instead of 30" row spacing) and tighter average plant spacing. Higher ear counts will to a degree offset lighter test weights and/or more tip back due to dryness.
The price drops Tuesday are not an unvarnished negative for producers. Some producers have hedge gains. More have at least partial forward contract coverage. Most have crop revenue insurance in some flavor or another. That could pay off big for those in low-yield areas, if prices stay down here through October rather than putting in an early harvest low. The spring price was $5.91 for corn and $13.76 for soybeans. If prices remain low, you are substituting money from the government and insurance companies for money from the market. You must have the yield losses to collect the big money. As a reminder, the harvest price option for corn and soybean crop insurance is computed during October.
Alan Brugler may be reached at alanb@bruglermktg.com
(c) Copyright 2023 DTN, LLC. All rights reserved.