

USDA May 1 Cattle on Feed Report
May 1 Cattle on Feed Down 3%
This article was originally posted at 2:04 p.m. CDT on Friday, May 19. It was last updated with additional information at 2:36 p.m. CDT on Friday, May 19.
**
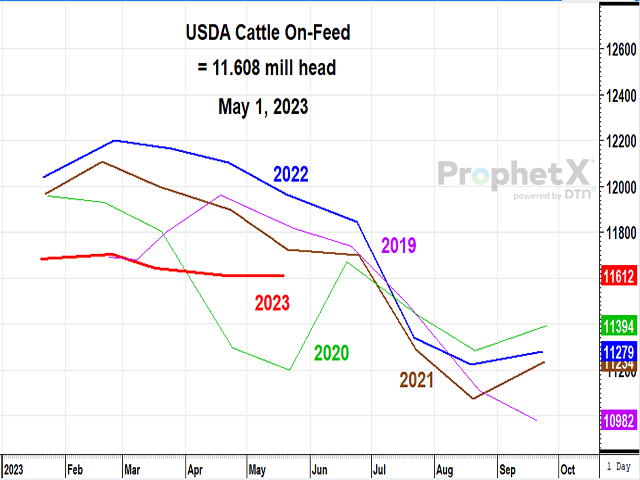
OMAHA (DTN) -- Cattle and calves on feed for the slaughter market in the United States for feedlots with capacity of 1,000 or more head totaled 11.6 million head on May 1, 2023. The inventory was 3% below May 1, 2022, USDA NASS reported on Friday.
P[L1] D[0x0] M[300x250] OOP[F] ADUNIT[] T[]
Placements in feedlots during April totaled 1.75 million head, 4% below 2022. Net placements were 1.70 million head. During April, placements of cattle and calves weighing less than 600 pounds were 360,000 head, 600-699 pounds were 245,000 head, 700-799 pounds were 410,000 head, 800-899 pounds were 458,000 head, 900-999 pounds were 205,000 head, and 1,000 pounds and greater were 70,000 head.
Marketings of fed cattle during April totaled 1.70 million head, 10% below 2022.
Other disappearance totaled 51,000 head during April, 6% below 2022.
DTN ANALYSIS
"Seeing Friday's Cattle on Feed report comes as a reassuring sigh of relief, as the report should undoubtedly be viewed as neutral," said DTN Livestock Analyst ShayLe Stewart.
"Once again, the biggest wild card of Friday's report was the placement data. With analysts unsure of where actual numbers would fall, given that they had a widespread data range of 90.5% to 99.6%, it's relieving to see that Friday's placements totaled 1.75 million head, or 96% of a year ago. The states that saw the biggest change in placements compared to a year ago were Idaho (up 6%), Minnesota (up 21%), Oklahoma (up 7%) and South Dakota (up 15%). And when compared to a month ago, the states that saw greater placements were Minnesota (up 13%) and Oklahoma (up 5%). It's relieving to see total placement numbers where they are, as there was some concern that with heightened imports from Mexico that placements could have landed closer to being steady with a year ago as opposed to down 4%. But with placements being down 4% compared to a year ago and total on-feed numbers being less as well, both the live cattle and feeder cattle markets should be able to keep with their upward trend.
"Some may be bewildered with today's marketed data, as it only comes in at 90% of a year ago. In a normal market scenario, we'd be worried that this would consequently lead to an overabundance of market-ready fed cattle supplies and subconsciously pressure fat cattle prices. But with understanding where the market sits in its current cycle position, we know that packers have dialed back processing speeds from year-ago levels as a way to keep cash cattle prices in check and that there simply aren't as many cattle in the system to market today as there was a year ago. Fed cattle supplies are extremely current, and so long as processing speeds remain at least steady with their current pace, an overabundance of market-ready cattle is not in the market's immediate future."
**
DTN subscribers can view the full Cattle on Feed reports in the Livestock Archives folder under the Markets menu. The report is also available at https://www.nass.usda.gov/….
| USDA Actual | Average Estimate | Range | |
| On Feed May 1 | 97% | 96.7% | 95.9-97.2% |
| Placed in April | 96% | 95.9% | 90.5-99.6% |
| Marketed in April | 90% | 90.0% | 89.0-90.5% |
(c) Copyright 2023 DTN, LLC. All rights reserved.