

Drought Sinks HRW Wheat Yields
Gro Intelligence Sees 2023 Hard Red Winter Wheat Yields Below Last Year
MT. JULIET, Tenn. (DTN) -- Farmers planted hard red winter wheat into the dust last fall and the drought impact shows -- not only in Twitter photos of devastating stands, but also in satellite images.
Those images are one piece of data that informs Gro Intelligence's 14 yield forecasting models, which use artificial intelligence, machine learning and mountains of data to generate forecasts for corn, soybean and wheat crops worldwide.
"Yields are looking a bit worse than last year because Kansas is definitely worse, and I think last year, Texas and Oklahoma were worse," Gro Senior Analyst Will Osnato said. Last year, USDA said farmers grew 531 million bushels (mb) of HRW wheat, almost 30% less than in 2021. Early estimates ahead of Friday's Crop Production report show that analysts expect USDA will peg this year's crop around 588 mb. A preview of Friday's report can be found here: https://www.dtnpf.com/…
Gro Intelligence's Hard Red Winter Wheat yield forecast model is only available to its customers. Each August, Gro Intelligence shares the proprietary yield estimates of its corn and soybean models with DTN as part the Digital Yield Tour. That tour will take place Aug. 7-11, 2023.
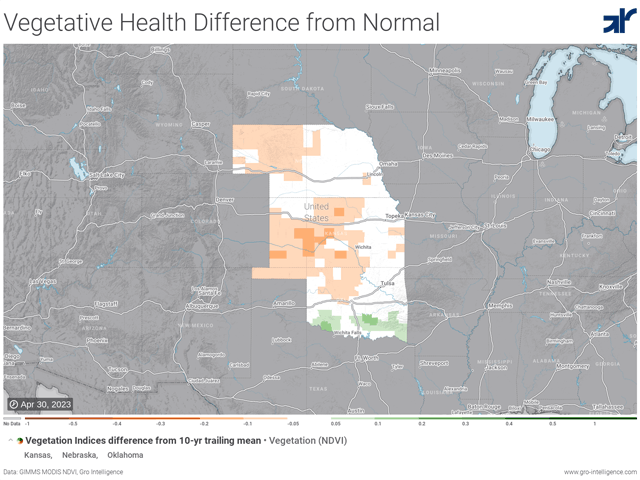
While Gro didn't share wheat yield estimates with DTN, Osnato and Gro Senior Analyst Jon Haines did show some of the factors that go into its yield model, including NDVI deviation maps, drought maps, weather forecasts and historical comparisons. The normalized difference vegetation index, or NDVI, quantifies the greenness of a crop, thereby assessing its health.
P[L1] D[0x0] M[300x250] OOP[F] ADUNIT[] T[]
Haines looked at the NDVI deviation map (see the image with this story), which compares this year's satellite imagery to the average of the previous 10 years. The maps show crop conditions that are worse and more widespread than last year, especially over south-central Kansas's top-producing wheat counties. Conditions are closer to average over the eastern third of the state, which grows more corn and less wheat, and there are some counties in the northwest corner of the state that show yields trending closer to average.
"In winter wheat growing areas of Kansas, the NDVI levels, aggregated together, are the lowest they've been in 23 years," Haines said. The most similar year is 2018, which saw conditions improve through the second half of May and early June.
DTN Ag Meteorologist John Baranick said that's unlikely to happen this year. "The way the forecast looks, it's all a bunch of scattered blotches of precipitation," he said. "It's not drought busting by any means."
A key difference in this year's crop is that when it got its start in fall of 2022, NDVI levels in Kansas were already at their lowest point ever.
Haines said Gro's done a historical analysis comparing drought levels to abandonment rates. At similar drought rates, Kansas abandonment rates are about 10% while it runs closer to 65% in Texas.
"Given what we've been talking about with the length of this drought, I would say abandonment rates are probably on the worst end of the historical range, because this is as bad as you can get," Haines said.
The Wheat Quality Council's annual hard red winter wheat crop tour begins next week, in which scouts will travel across Kansas and part of Oklahoma to survey the crop. DTN's Joel Reichenberger is attending and will write daily updates.
You can learn more about Gro Intelligence and its forecasting methods at https://www.gro-intelligence.com/….
Katie Dehlinger can be reached at katie.dehlinger@dtn.com
Follow her on Twitter @KatieD_DTN
(c) Copyright 2023 DTN, LLC. All rights reserved.