

Ag Weather Forum
What Does It Take to Get Out of Drought?
Though it is seven letters long, drought has become a four-letter word to most farmers and ranchers across the country this year. Very few spots around the country have remained out of some sort of category of dryness or drought on the U.S. Drought Monitor (USDM) this year.
It is a favorite map of mine to look at, and most producers as well. The map is a partnership between the National Drought Mitigation Center (NDMC), USDA, and NOAA and does a good job of creating a single, simple map that can point to various groundwater issues that impact so many industries, not just agriculture.
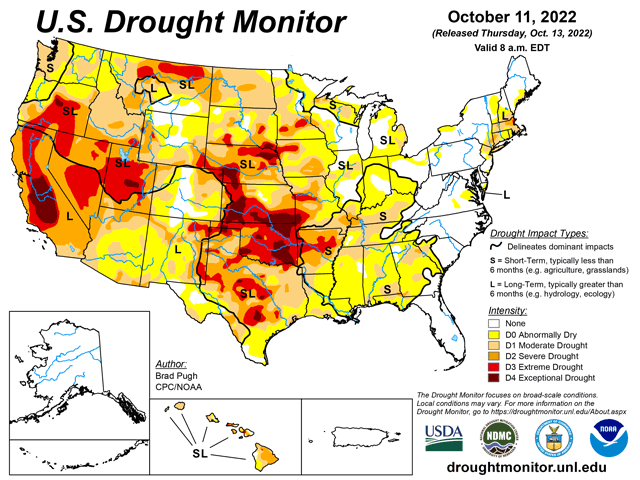
Drought has been increasing in recent weeks across a lot of the U.S. due to below-normal rainfall. Outside of the rain from Hurricane Ian on the East Coast and an upper-level low in the Southwest, dryness and drought have expanded from the Pacific Northwest through most of the Plains, Midwest, and Southeast over the last month.
The latest update to the USDM issued on Oct. 13 paints a whopping 81.78% of the Continental U.S. in some category of dryness or drought. That is up about 10% from the start of the year and the most expansive coloring on the map in their records going back to the beginning of 2000. Speaking specifically about drought, at 55.41% of the Continental U.S., it is the highest coverage of drought since April 19. The drought coverage peaked this year in early March at 61.11%, which was the most expansive drought since 2012.
P[L1] D[0x0] M[300x250] OOP[F] ADUNIT[] T[]
Drought has been entrenched throughout most of the West and Central and Southern Plains all year long and has wavered in-and-out elsewhere. It has been hard to get rid of unless you live east of the Mississippi River. So, the question is: how much rain will it take to end this drought?
According to the NDMC's website, it is not a simple number. Drought is a "convergence of evidence" of several different indicators that fall into one of these categories: precipitation, streamflow, reservoir levels, temperature and evaporative demand, soil moisture, vegetation health, impact reports from media outlets and private citizens, and the input of over 450 local experts throughout the country. In other words, you cannot objectively determine if you will get out of the drought categories by a simple look at the past week's rainfall. There are more indicators that go into it.
In an email to DTN, Brian Fuchs, Geoscientist, Climatologist, and one of the authors of the USDM at the NDMC, wrote that "there is a subjective nature to this work, but all of the authors follow the same guidance in that we don't just look at the best or the worst indicators, but where the majority of them are converging...the impact of a single rain event on the entire water balance/water cycle of an area is not always easiest to capture when looking at individual indices, but when we start looking at them all, we get a better idea of how much the drought improved/degraded in a given week. That is why straight precipitation data does not tell the full story. An area could be considered "normal" for annual precipitation, but that number does not tell you how many events occurred or how hard the rains came." This suggests that what may be important for agricultural drought may not fit for ecological or socio-economic drought. A rainfall event may improve conditions for one more than the other, and it is up to the USDM authors to take all that into account when drawing categories.
This also means that a simple look at the map also does not tell the whole story; the change over time is also important, especially for agriculture. Going from D4 -- exceptional drought to D2 -- severe drought will have a different meaning than going from no drought to D2 -- severe drought. Momentum is important in agriculture because it is often an indicator of soil moisture availability for crops or pastures to use. Crops can be in good standing in drought conditions or could have limitations when drought is not indicated on the map.
The categories on the Drought Monitor map become a little more complicated and the Center notes that it is impossible to describe all the impacts with a single map for all locations. Precipitation is a highly variable event both across distance and time and getting the impacts for all sectors into one map is a challenge. However, the Center does do a good job of assessing the main impacts for most sectors. Drought classification on the Drought Monitor is not a declaration of drought -- only governments can make those declarations. But the map and its comments are tools for those decision-makers to use.
To learn more about how the U.S. Drought Monitor map is produced, visit https://drought.unl.edu/….
To find more regional weather conditions and your local forecast from DTN, head over to https://www.dtnpf.com/…
John Baranick can be reached at john.baranick@dtn.co
(c) Copyright 2022 DTN, LLC. All rights reserved.