

USDA Reports Review
Surprise Fall in US Soybean Yield Sends Soy Higher
Perhaps the biggest surprise in an otherwise dull October USDA World Agricultural Supply and Demand Estimates (WASDE) report was soybeans seeing a sharp gain. However, the report slashed demand for corn, soybean and wheat to account for the slow pace of exports, ongoing river issues and the demand-dampening impact of global recession and high interest rates.
Here's a more in-depth look at some of the changes in both U.S. and world numbers on the Oct. 12 USDA reports.
CORN
The corn portion of the October WASDE report turned out to be mostly a dud. With Dow Jones' pre-report survey looking for a corn yield of 171.9 bushels per acre (bpa), and production of 13.891 billion bushels (bb), both of those came out almost right on the money. However, ending stocks were up just slightly higher than traders had expected due to some bearish demand changes. Yield was revealed to be 171.9 bpa, down 0.6 bpa from September, with production of 13.895 bb, using unchanged planted and harvested acres, with the latter at 80.8 million acres. However, due to the brutally slow export pace of U.S. corn, with sales currently down 50% from last year and with the sluggish ethanol demand of late, USDA chose to drop both of those by 125 million bushels (mb) and 50 mb, respectively. Partly offsetting those reductions was a 50 mb increase in feed and residual. The net effect was a drop in ending stocks from 1.219 bb to 1.172 bb, a decline of 37 mb from last month. The ending stocks number figured 45 mb higher than trade expectations. The season average corn price was increased by a nickel to $6.80.
On a side note, the Oct. 1 objective yield data pointed to the seventh-highest number of ears on record in the 10 major states, with the tenth- highest production of 13.9 bb. The 171.9 bpa yield figured 3% below last year's record-large 176.7 bpa.
Major producer, Illinois had a record yield this year.
On the world front, ending stocks fell by 3.3 mmt to 301.2 mmt (11.86 bb) for 2022-23. That compares to 307.1 mmt (12.09 bb) in 2021-22. Perhaps the most notable change in the world numbers was the decline of 2.6 mmt in the European maize crop to 56.2 mmt (2.21 bb). The other notable world change was an increase of 1 mmt to 20 mmt (787 mb) for EU corn imports. Despite the fact that Ukraine corn production was left unchanged, at 31.5 mmt (1.24 bb), Ukraine exports were raised by 2.5 mmt to 15.5 mmt (610 mb). World production, less China, amounted to a decline of 3.9 mmt (154 mb) from September.
P[L1] D[0x0] M[300x250] OOP[F] ADUNIT[] T[]
Even though the ending stocks numbers are moving in a bullish direction, moving from 1.377 bb last year to 1.172 bb, some feel that, due to competition from Ukraine and Brazil, and river problems, we could see further declines in corn demand.
SOYBEANS
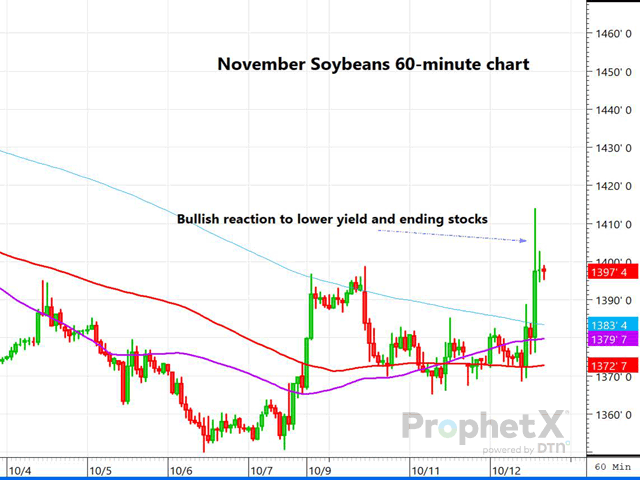
The soybean market provided the only excitement for the October WASDE, as yield was reported to be 0.7 bpa under the September yield of 50.5 bpa. That resulted in production, on unchanged harvested acres of 86.6 million, falling to 4.313 bb from 4.378 bb last month. It's apparent that the very hot and dry finish in parts of the western and southwestern Plains had a detrimental impact on yield. As in corn, soybean export demand was lowered, with a 40 mb cut, but that was partially offset by a rise in crush of 10 mb. The 49.8 bpa yield was down nearly 2 bushels from last year's 51.7 bpa. Record yields were recorded in Arkansas, Mississippi and South Carolina. Of the 11 key states measured on Oct.1, in eight of those states, pod counts were lower than in 2021, with Nebraska having the largest decrease of 551 pods per 18 square feet. The tight 200 mb ending stocks number was 40 mb higher than the trade average estimate prior to the report.
On the global side, ending stocks moved higher, from 98.9 mmt to 100.5 mmt (3.69 bb). Some notable changes were an increase of 3 mmt in Brazil's soy production to 152 mmt (5.59 bb), nearly matching that of supply company, CONAB (152.4 mmt). Argentine soybean exports were increased by 2.3 mmt to 7 mmt (257 mb), and Brazil exports were raised by 500,000 mt to 89.5 mmt (3.29 bb), while Paraguay's exports were lowered by 750,000 mt, and U.S. exports were dropped by 1 mmt.
The soybean market reacted to the bullish yield, production and ending stocks changes to close nearly 20 cents higher, but well below the daily high of $14.14 in November.
WHEAT
The wheat changes reflected the lower production of 1.650 bb from the Sept. 30 stocks and acreage report, along with some demand changes as well. Wheat imports were increased by 10 mb, while feed and residual use was lowered by 30 mb based on the lowest first quarter disappearance since 1983-84. Exports were also slashed by 50 mb, due to the U.S. being uncompetitive, to 775 mb, and the lowest since 1971-72. The combined changes sent U.S. ending wheat stocks to 576 mb -- down 34 mb, the lowest ending stocks since 2007-2008. The season average price for wheat was raised 20 cents to $9.20 per bushel. The ending stocks were just 12 mb higher than what Dow Jones traders had expected. It is very possible that further export cuts could be in the offing, as the U.S. has steadily been undercut by Black Sea exporters. Most of the decline came in the soft red wheat market, falling from 125 mb in September to just 91 mb now.
World changes in wheat were minimal, with perhaps the biggest surprise coming for Russia, with WASDE leaving Russian wheat production unchanged at 91 mmt (3.34 bb), despite several private analysts projecting close to 100 mmt (3.67 bb). Argentine production was lowered by 1.5 mmt to 17.5 mmt (643 mb) based on the ongoing drought, and Argentine exports fell 1 mmt to 12 mmt (440 mb). The EU wheat crop increased by 2.7 mmt to 134.8 mmt (4.95 bb), and EU exports were increased by 1.5 mmt to 35 mmt (1.29 bb).
World ending wheat stocks fell to 267.6 mmt (9.83 bb), which was just slightly higher than the average trade estimate, but well below last year's 276 mmt (10.1 bb) total.
The wheat market was trading about 7-8 cents lower prior to the report and ended down nearly 21 cents in Kansas City.
FINAL THOUGHTS
While all three markets featured sizable declines in ending stocks levels from the 2021-22 season, what really stood out was the decline in demand for all three markets, mostly on the export side, reflecting stiff competition, barge traffic issues and world economic recession issues. Some analysts feel that we could see further declines in corn and soy demand in future reports despite some of the tightest ending stocks that we have seen in years.
The focus will now likely shift to South American weather, Black Sea developments and the global economic challenges ahead.
To end the day, December corn finished unchanged at $6.93, November beans were up 19 3/4 cents at $13.96, and December Kansas City wheat fell 20 3/4 cents to settle at $9.70.
Dana Mantini can be reached at dana.mantini@dtn.com
Follow Dana Mantini on Twitter @mantini_r
(c) Copyright 2022 DTN, LLC. All rights reserved.